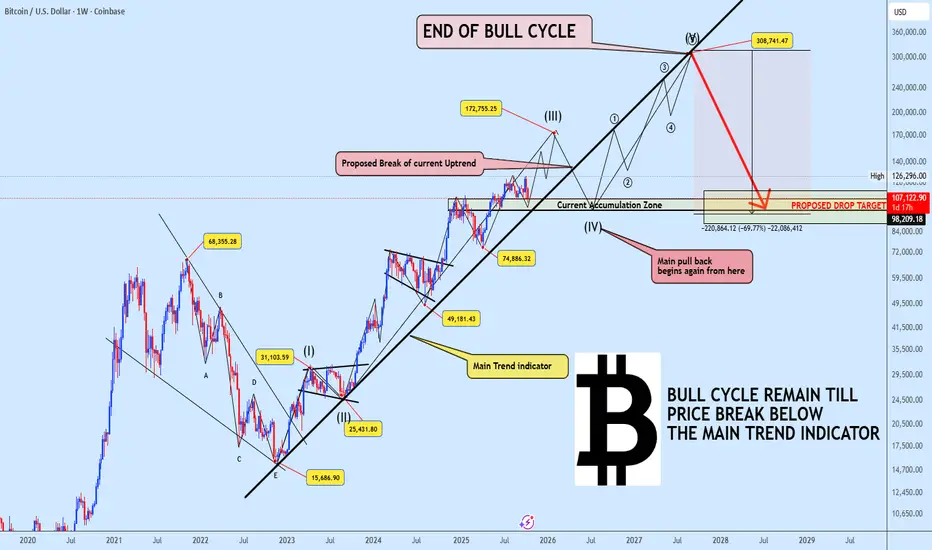
Bitcoin continues to respect the Main Trend Indicator, keeping the broader super cycle wave (3) intact. Based on our projection, the ongoing bullish leg is expected to complete near $172,000, marking the end of wave (III).
From there, we anticipate a corrective wave (IV) to unfold likely breaking below the uptrend support toward the $107K region. This move will act as the last deep pullback before Bitcoin begins its final explosive rally (wave V) that could extend toward $300K, concluding the entire bull cycle before a true bear market emerges.
Historical Parallel:
To understand this better, it’s important to recall the 2020–2021 bull cycle. Back then, BTC repeatedly tested a similar dynamic trendline, maintaining its strength as long as the structure held. Even after the eventual breakdown that confirmed the bull cycle’s exhaustion, price still pushed to a new all-time high before the real decline began.

This serves as a crucial reminder market tops rarely happen instantly. They evolve with clear structural warnings, and we may be approaching such a phase again.
Key Takeaway:
As long as Bitcoin trades above the Main Trend Indicator, the bull cycle remains valid.
A confirmed breakdown below it, however, will signal the start of the macro correction phase one that may eventually reset the entire structure.
Stay prepared, stay disciplined, and understand that each phase of the cycle brings new opportunities. If you find this analysis insightful, don’t forget to like, share, and drop your thoughts below, your engagement helps keep quality analysis alive!
Meanwhile, I’ve noticed a surge in volume across Binance Alpha projects. Drop your coin name below for a quick market analysis.
From there, we anticipate a corrective wave (IV) to unfold likely breaking below the uptrend support toward the $107K region. This move will act as the last deep pullback before Bitcoin begins its final explosive rally (wave V) that could extend toward $300K, concluding the entire bull cycle before a true bear market emerges.
Historical Parallel:
To understand this better, it’s important to recall the 2020–2021 bull cycle. Back then, BTC repeatedly tested a similar dynamic trendline, maintaining its strength as long as the structure held. Even after the eventual breakdown that confirmed the bull cycle’s exhaustion, price still pushed to a new all-time high before the real decline began.
This serves as a crucial reminder market tops rarely happen instantly. They evolve with clear structural warnings, and we may be approaching such a phase again.
Key Takeaway:
As long as Bitcoin trades above the Main Trend Indicator, the bull cycle remains valid.
A confirmed breakdown below it, however, will signal the start of the macro correction phase one that may eventually reset the entire structure.
Stay prepared, stay disciplined, and understand that each phase of the cycle brings new opportunities. If you find this analysis insightful, don’t forget to like, share, and drop your thoughts below, your engagement helps keep quality analysis alive!
Meanwhile, I’ve noticed a surge in volume across Binance Alpha projects. Drop your coin name below for a quick market analysis.
注释
Market shifts occur only when price break below this multi-weekly trendline.交易开始
We can see that the lower timeframes are still in a potential consolidation zone, with the price currently testing the bottom of the key support. A bounce could occur at any time, with the worst-case scenario being a re-test of the $104k level. Price action on the 3-day chart suggests a potential zig-zag corrective pattern, indicating the next wave is likely to the upside. Our exit strategy remains unchanged: we will invalidate the bullish thesis if price breaks below the main support zone.
注释
Local resistance breakout注释
Drop your altcoins below let’s analyze them together for quick and precise market insights.交易手动结束
Bitcoin’s recovery path is gradually taking shape, though there’s still significant supply to clear ahead. We’ll reassess our outlook as we close this current thread for now, thanks for following along.注释
If Bitcoin Loses $98K, the Whole Bull Cycle Could Be in Danger♻️♻️🔁 Like, share & comment your view.

📢 Follow Only Official Links – Trade Smart, Stay Safe
🔹 Main Channel: t.me/+m0IACMn0ul03OTFk
🔹 Forex Zone: t.me/+piiPgrNtrulkNDk0
📩 For Promotions, Advertisements & Partnerships: @WESLAD
🔹 Main Channel: t.me/+m0IACMn0ul03OTFk
🔹 Forex Zone: t.me/+piiPgrNtrulkNDk0
📩 For Promotions, Advertisements & Partnerships: @WESLAD
免责声明
这些信息和出版物并不意味着也不构成TradingView提供或认可的金融、投资、交易或其它类型的建议或背书。请在使用条款阅读更多信息。