What about the short-term, when will Bitcoin recover?
We can't say when Bitcoin will recover or not but we can easily read the chart.
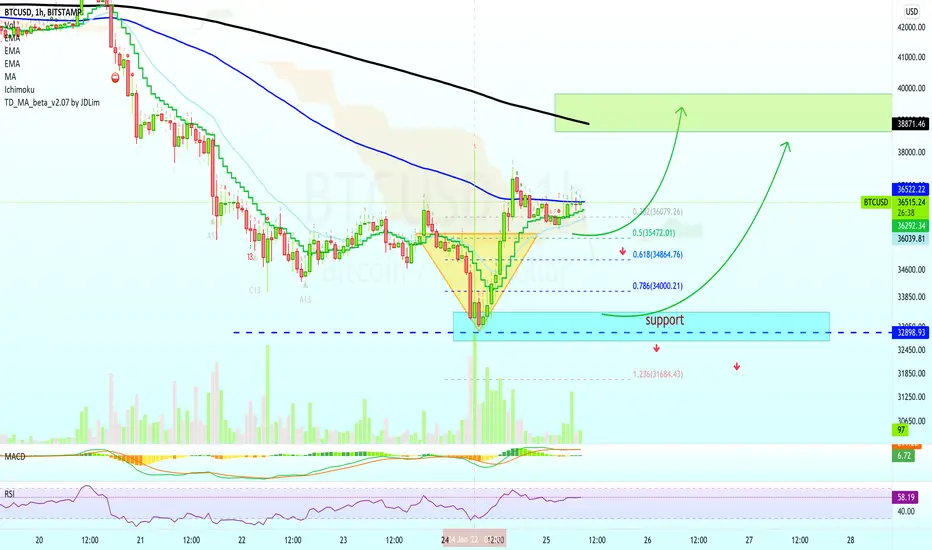
Here we have Bitcoin on the 1H timeframe, so this chart can move fast.
First, we have the "V bottom" pattern marked yellow on this chart. This is a good starting point.
Once this pattern showed up we also have really high volume and a long upper shadow on a candle that hit $38,050, this can be a good reversal signal.
So we have a strong bounce on high volume with bullish indicators.
Currently, prices are sitting above EMA10 and below EMA100.
EMA100 is the next immediate resistance.
Any trading above the "V bottom" low and "support" zone we are bullish. You can expect higher prices above this level.
If support breaks, we expect lower prices.
Additional details on the chart.
Namaste.
We can't say when Bitcoin will recover or not but we can easily read the chart.
Here we have Bitcoin on the 1H timeframe, so this chart can move fast.
First, we have the "V bottom" pattern marked yellow on this chart. This is a good starting point.
Once this pattern showed up we also have really high volume and a long upper shadow on a candle that hit $38,050, this can be a good reversal signal.
So we have a strong bounce on high volume with bullish indicators.
Currently, prices are sitting above EMA10 and below EMA100.
EMA100 is the next immediate resistance.
Any trading above the "V bottom" low and "support" zone we are bullish. You can expect higher prices above this level.
If support breaks, we expect lower prices.
Additional details on the chart.
Namaste.
🚨 LIFETIME (Pay 1, Get 7)
lamatrades.com —Since 2017
🚨 Results
ETH +2150%
CRO +1272%
AAVE +1134%
DOGS +868%
SOL +861%
XRP +749%
BTC +580%
t.me/masteranandatrades/6681
😱 Wow & New Results
t.me/anandatrades/1350
lamatrades.com —Since 2017
🚨 Results
ETH +2150%
CRO +1272%
AAVE +1134%
DOGS +868%
SOL +861%
XRP +749%
BTC +580%
t.me/masteranandatrades/6681
😱 Wow & New Results
t.me/anandatrades/1350
相关出版物
免责声明
这些信息和出版物并不意味着也不构成TradingView提供或认可的金融、投资、交易或其它类型的建议或背书。请在使用条款阅读更多信息。