📊 Chart Overview
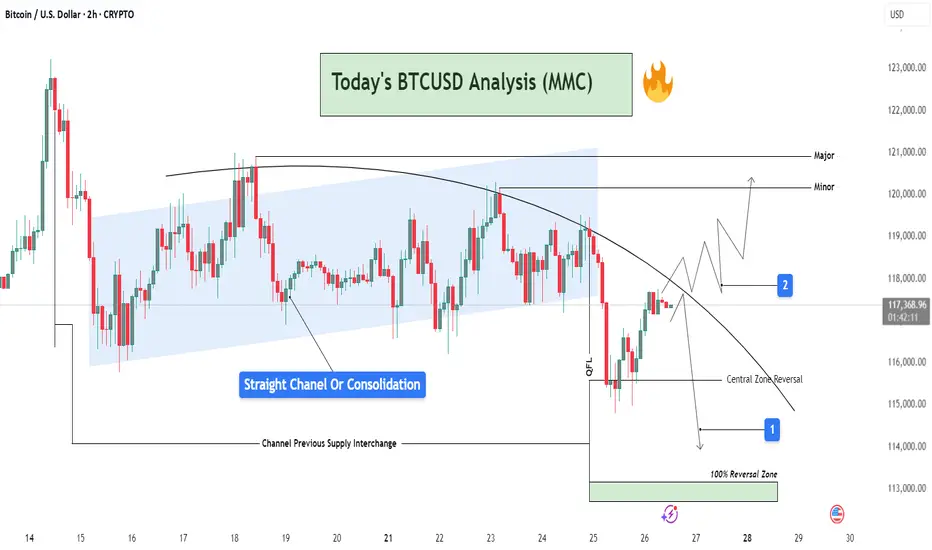
This 2H BTCUSD chart reveals a comprehensive view of market behavior transitioning from a phase of consolidation into a potential breakout or further rejection. The price action is analyzed inside a parallel channel, transitioning into a curved resistance path, which is currently governing the market structure.
🔵 Phase 1: Consolidation Inside a Straight Channel
Price has respected a clear ascending channel (highlighted in blue) from July 16 to July 24.
This phase shows a range-bound movement with defined supply and demand zones.
Labelled as “Straight Channel or Consolidation”, this represents a potential accumulation/distribution zone.
The Channel Previous Supply Interchange marks an important S/R flip zone, now serving as a key reference for future reactions.
🔻 Phase 2: Break of Structure & Curved Resistance
Price broke down below the channel support and is now respecting a downward curved trendline.
This indicates a shift in momentum from neutral to bearish, forming lower highs.
A sharp drop occurred post-channel exit, marking a QFL (Quasimodo Failure Level) area—hinting at smart money involvement or liquidation hunt.
🔁 Reversal Scenarios & Key Levels
There are two possible future paths visualized:
🟥 Scenario 1: Bearish Continuation
Price respects the curved trendline, failing to break resistance.
A rejection near the current region (~117.5k) could lead price back toward:
Central Zone Reversal near 115,000 USD
Further into the 100% Reversal Zone (green zone) near 113,500–114,000 USD
Ideal for short entries after clear rejection confirmations.
🟩 Scenario 2: Bullish Breakout
Price breaks and sustains above the curved resistance.
Temporary resistance seen at Minor level (~120,000 USD), followed by Major resistance near 121,000 USD.
This scenario requires bullish volume and reclaim of structure, invalidating the short bias.
🧠 Strategic Viewpoint & Trade Mindset
Market is at a decision point—either confirming a bearish rejection from dynamic resistance or invalidating it for a bullish reversal.
Patience is key; wait for either:
A failed breakout attempt (short opportunity), or
A confirmed breakout and retest (long opportunity).
Use lower timeframes (15m–1h) for execution once direction is confirmed.
相关出版物
免责声明
The information and publications are not meant to be, and do not constitute, financial, investment, trading, or other types of advice or recommendations supplied or endorsed by TradingView. Read more in the Terms of Use.
免责声明
The information and publications are not meant to be, and do not constitute, financial, investment, trading, or other types of advice or recommendations supplied or endorsed by TradingView. Read more in the Terms of Use.