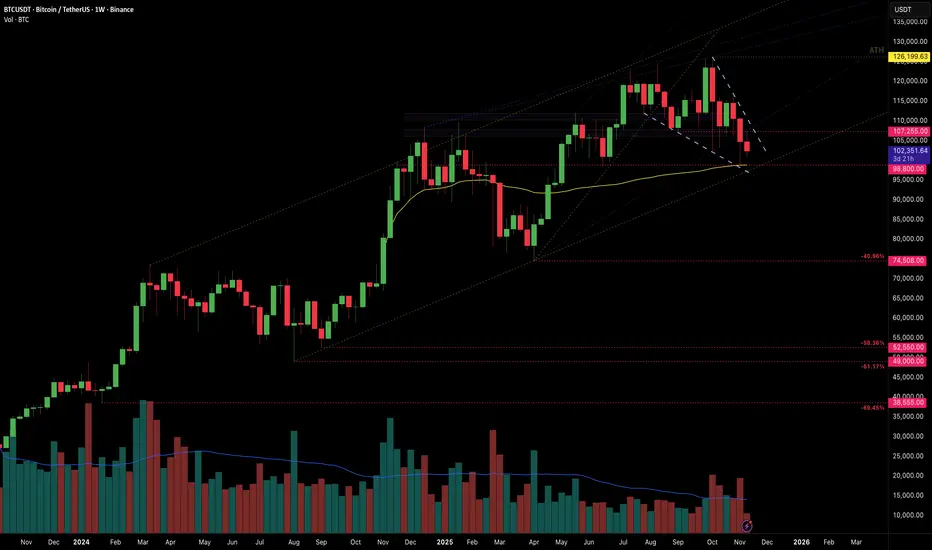
Since failure to break above 126K, I am looking for continuation of descent towards levels market in red. We have:
1. Three failed attempts to go above 120K.
2. Dominating selling volume on weekly BTC market capitalization chart.
3. Diamond / Bear Wedge Patterns formation on daily and weekly timeframes.
4. Approximate end of Bitcoin bull cycle.
5. Absence of supporting buy-back volume on any time frame.
6. Most of the pumps get dumped within an hour.
7. Clear huge sellers at 108K zone and 102K.
注释
- June, July, August, September = quiet months whose volume staying under the average line.- Look at October and November already. Crushing bearish volume.
- There were little buybacks. Look at green volume. It is not there. For months institutional buyers have already left the game leaving only retailers chasing the faked momentum.
- 401K won't save the overhyped crypto ETF macro this time. Why? Because only <1% goes into crypto overall.
注释
Update: 注释
New 6 months low set. Now on to the targets. 90K will likely be next support.注释
I am not calling this a bear market. But there are enormous number of signs indicating that crypto only will enter it soon.
Master The Fall 🔻
Rise Above All #1
Rise Above All #1
免责声明
这些信息和出版物并非旨在提供,也不构成TradingView提供或认可的任何形式的财务、投资、交易或其他类型的建议或推荐。请阅读使用条款了解更多信息。
Master The Fall 🔻
Rise Above All #1
Rise Above All #1
免责声明
这些信息和出版物并非旨在提供,也不构成TradingView提供或认可的任何形式的财务、投资、交易或其他类型的建议或推荐。请阅读使用条款了解更多信息。