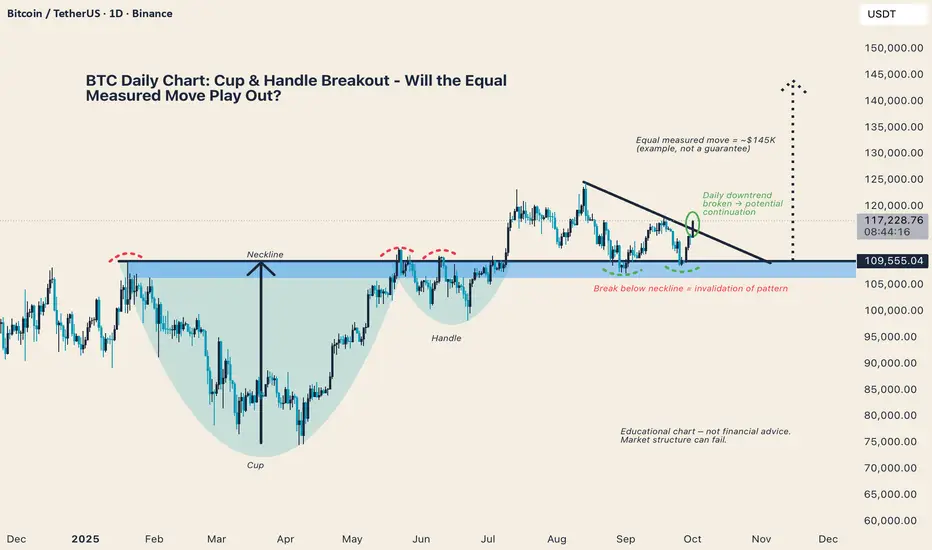
Bitcoin has broken above its daily downtrend while holding above the neckline of a Cup & Handle formation.
Equal Measured Move Example: ~$145K (for educational purposes, not a guarantee)
Key Structure: Sustained closes above the neckline support continuation
Invalidation Level: A decisive break back below the neckline would negate the setup
⚠️ Educational Chart - Market structure can fail. This analysis is for learning purposes only, not financial advice.
What do you think - is this the breakout that pushes BTC into its next leg higher, or will neckline support fail?
免责声明
这些信息和出版物并不意味着也不构成TradingView提供或认可的金融、投资、交易或其它类型的建议或背书。请在使用条款阅读更多信息。
免责声明
这些信息和出版物并不意味着也不构成TradingView提供或认可的金融、投资、交易或其它类型的建议或背书。请在使用条款阅读更多信息。