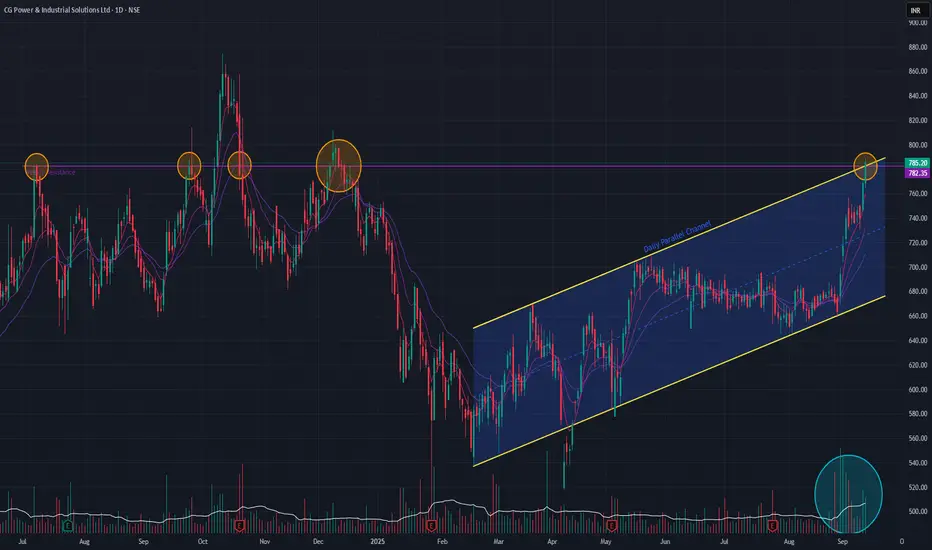
CG Power has been consolidating below a major horizontal resistance line established in July 2024, which has so far prevented new all-time highs. Following a downtrend that began in October 2024, the stock has been trading within a well-defined parallel channel.
Today's price action is particularly bullish, as the stock is attempting a breakout from a confluence of resistance: the top of the parallel channel and the long-term horizontal trendline.
This significant move is supported by two key technical indicators:
A sustained breakout above this confluence would be a strong signal that the uptrend is resuming.
Today's price action is particularly bullish, as the stock is attempting a breakout from a confluence of resistance: the top of the parallel channel and the long-term horizontal trendline.
This significant move is supported by two key technical indicators:
- The short-term EMAs are in a Positive Crossover (PCO) state.
- An SMA Golden Cross occurred just a few days ago.
A sustained breakout above this confluence would be a strong signal that the uptrend is resuming.
Disclaimer: This analysis is my personal view & for educational purposes only. They shall not be construed as trade or investment advice. Before making any financial decision, it is imperative that you consult with a qualified financial professional.
免责声明
这些信息和出版物并不意味着也不构成TradingView提供或认可的金融、投资、交易或其它类型的建议或背书。请在使用条款阅读更多信息。