All Plotted and Mentioned on Chart.
Color code:
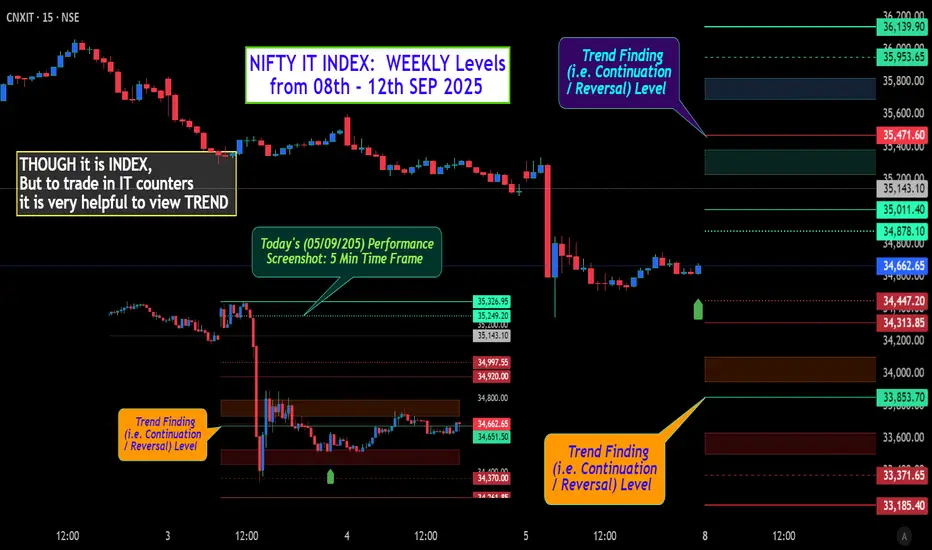
Green =. Positive bias.
Red =. Negative bias.
RED in Between Green means Trend Finder / Momentum Change
/ CYCLE Change and Vice Versa.
Notice One thing: HOW LEVELS are Working.
Use any Momentum Indicator / Oscillatoror as you "USED to" to Take entry.
Disclaimer: Study Purpose only.
Color code:
Green =. Positive bias.
Red =. Negative bias.
RED in Between Green means Trend Finder / Momentum Change
/ CYCLE Change and Vice Versa.
Notice One thing: HOW LEVELS are Working.
Use any Momentum Indicator / Oscillatoror as you "USED to" to Take entry.
Disclaimer: Study Purpose only.
交易开始
NIFTY IT INDEX @ 35157: Inching Towards Hurdle Zone #1 after testing ST BUY Level placed @ 35011.40.Happy trading.
交易结束:到达目标
This index Crossed Top Weekly Level @ 36139.9 and treat this level as SUPPORT in Last 6-7 Candle(15 Min TF)相关出版物
免责声明
这些信息和出版物并不意味着也不构成TradingView提供或认可的金融、投资、交易或其它类型的建议或背书。请在使用条款阅读更多信息。