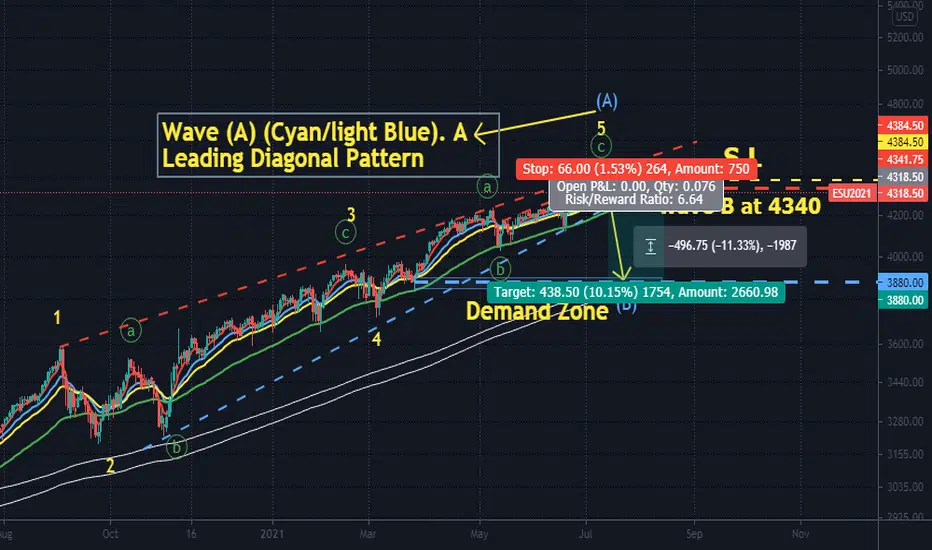
SPX with price breaking low of 4340 which is wave b of subwave of wave 5( Not shown on chart). SPX probably completed its leading diagonal pattern .. Short SPX toward around 3880 which is 1) Daily 200 EMA line 2) The Next Major Demand Zone ... Stop lost at 4384.50.... A Risk /Reward Ratio of about 6.64!
注释
xyz3dtrading.. Charts consist of 3Dimensions - The X-factor ( Time or Cycle ), The Y- factor ( Price Geometry ), AND The Z-factor ( The Speed )注释
It seem like SPX recent impulsive move down is a C leg of expanding flat pattern. SO SPX still will be breaking all time High again!免责声明
这些信息和出版物并非旨在提供,也不构成TradingView提供或认可的任何形式的财务、投资、交易或其他类型的建议或推荐。请阅读使用条款了解更多信息。