Sure, here’s your analysis translated to English, keeping the SMC/ICT logic:
---
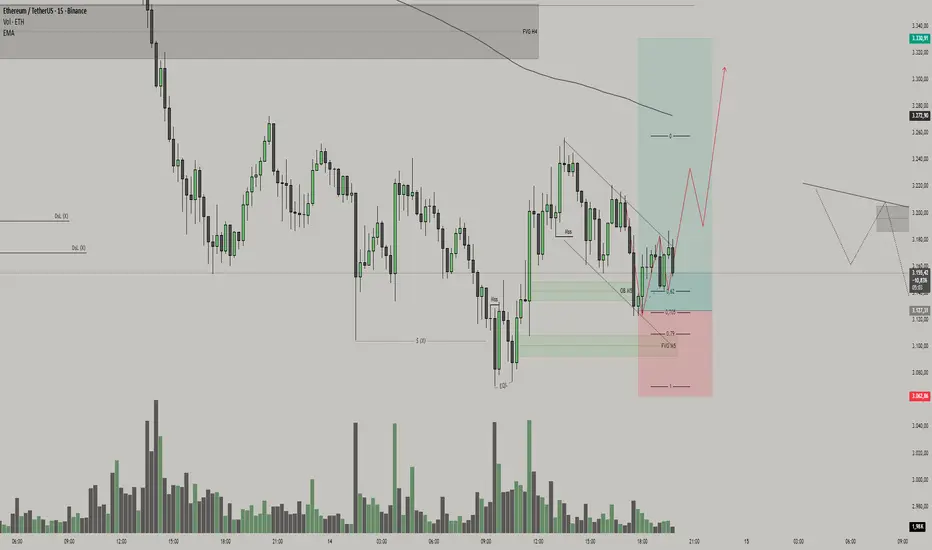
The chart shows ETH/USDT on the **M15**, inside a still bearish context, coming from a strong downside displacement that originated up in the **H4 FVG** (institutional supply zone). That leg down delivered price into **discount**, and after the first low (S QD), the market started to work inside a range, building liquidity on both sides.
On the right side of the chart we see the recent structure: price makes a new bearish impulse, **sweeps the previous low (Sweep of Dsl / sell-side liquidity)** and, right after that sweep, buying volume steps in and the market starts to react. This reaction creates a **bullish M5 order block** (marked in green) and an **M5 FVG** just below it, exactly where you drew the 0.62 / 0.705 / 0.79 retracements.
From an ICT perspective, this is classic:
* First, smart money reaches for liquidity below the lows (Sweep);
* Then it leaves an order block + imbalance in a discount area;
* After that, the expectation is **price expansion to the upside** toward an opposite liquidity/supply pool (in this case, the higher supply zone).
The descending dashed channel cutting through this reaction is the **“SSL” of the micro downtrend**. The break of this line together with a break of the last internal high gives us a **MSS/CHoCH to the upside** on intraday, suggesting that the efficient side *for now* is the buy side — not to fully reverse the macro trend, but to travel from “discount → premium”.
From this, the trade idea implied by the drawing is:
* **Buy zone (Demand/Entry):**
Pullback of price back into the **M5 OB + M5 FVG**, inside the 0.62–0.79 retracement block of the last bullish leg. That’s where we expect smart money to reload longs, defending the block after the Sweep.
* **Stop-loss (protection):**
Below the sweep low / bottom of the M5 FVG – around **3.06x** on the chart. If price accepts below that level, it means the OB failed and the long scenario is invalid.
* **Profit targets (take profit):**
1. **TP1:** return to the area of the last intraday highs (around **3.23x–3.25x**), where there’s buy-side liquidity to be taken.
2. **TP2 (main):** push into the **H4 FVG** around **3.33x**, which is the major higher-timeframe supply POI. In SMC logic: you’re aiming to capture the path of liquidity from the swept sell-side at the bottom up to the buy-side pool concentrated in that higher supply zone.
Once price reaches that **H4 FVG / institutional supply**, your own sketch already suggests the next SMC/ICT step: wait for distribution, a sweep of highs, and *then* look for a short scenario back down. In other words:
1. right now, the trade is a **long as a corrective move from discount**,
2. up there, you shift back to **shorts from the supply POI**.
All of this fits the SMC sequence: liquidity → displacement → OB/FVG mitigation → displacement in the opposite direction toward the next liquidity pool.
---
The chart shows ETH/USDT on the **M15**, inside a still bearish context, coming from a strong downside displacement that originated up in the **H4 FVG** (institutional supply zone). That leg down delivered price into **discount**, and after the first low (S QD), the market started to work inside a range, building liquidity on both sides.
On the right side of the chart we see the recent structure: price makes a new bearish impulse, **sweeps the previous low (Sweep of Dsl / sell-side liquidity)** and, right after that sweep, buying volume steps in and the market starts to react. This reaction creates a **bullish M5 order block** (marked in green) and an **M5 FVG** just below it, exactly where you drew the 0.62 / 0.705 / 0.79 retracements.
From an ICT perspective, this is classic:
* First, smart money reaches for liquidity below the lows (Sweep);
* Then it leaves an order block + imbalance in a discount area;
* After that, the expectation is **price expansion to the upside** toward an opposite liquidity/supply pool (in this case, the higher supply zone).
The descending dashed channel cutting through this reaction is the **“SSL” of the micro downtrend**. The break of this line together with a break of the last internal high gives us a **MSS/CHoCH to the upside** on intraday, suggesting that the efficient side *for now* is the buy side — not to fully reverse the macro trend, but to travel from “discount → premium”.
From this, the trade idea implied by the drawing is:
* **Buy zone (Demand/Entry):**
Pullback of price back into the **M5 OB + M5 FVG**, inside the 0.62–0.79 retracement block of the last bullish leg. That’s where we expect smart money to reload longs, defending the block after the Sweep.
* **Stop-loss (protection):**
Below the sweep low / bottom of the M5 FVG – around **3.06x** on the chart. If price accepts below that level, it means the OB failed and the long scenario is invalid.
* **Profit targets (take profit):**
1. **TP1:** return to the area of the last intraday highs (around **3.23x–3.25x**), where there’s buy-side liquidity to be taken.
2. **TP2 (main):** push into the **H4 FVG** around **3.33x**, which is the major higher-timeframe supply POI. In SMC logic: you’re aiming to capture the path of liquidity from the swept sell-side at the bottom up to the buy-side pool concentrated in that higher supply zone.
Once price reaches that **H4 FVG / institutional supply**, your own sketch already suggests the next SMC/ICT step: wait for distribution, a sweep of highs, and *then* look for a short scenario back down. In other words:
1. right now, the trade is a **long as a corrective move from discount**,
2. up there, you shift back to **shorts from the supply POI**.
All of this fits the SMC sequence: liquidity → displacement → OB/FVG mitigation → displacement in the opposite direction toward the next liquidity pool.
免责声明
这些信息和出版物并非旨在提供,也不构成TradingView提供或认可的任何形式的财务、投资、交易或其他类型的建议或推荐。请阅读使用条款了解更多信息。