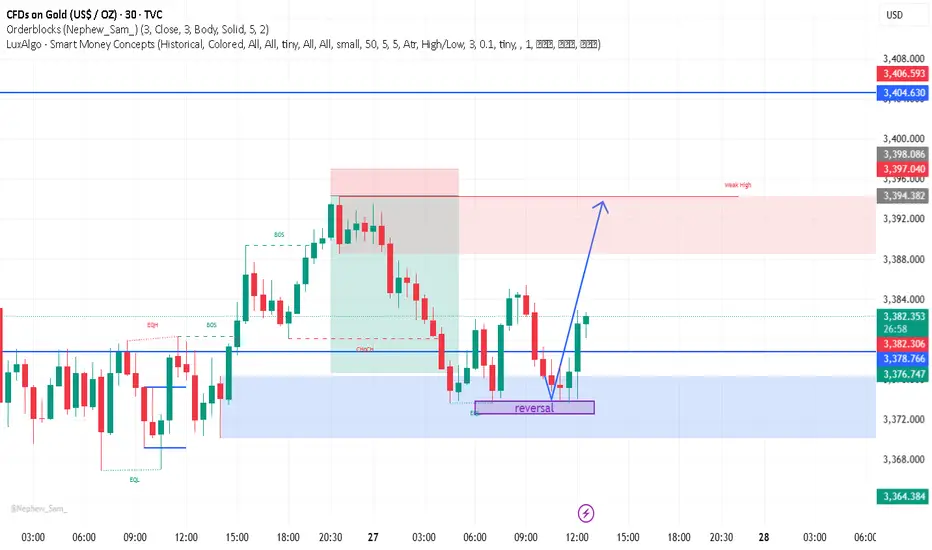
This gold (XAU/USD) 30-minute chart shows a recent **bullish reversal** after price reached a demand zone near 3,376–3,372. The chart highlights a “reversal” point within the blue demand area, where buyers stepped in to push price upward. A clear **change of character (ChoCH)** was noted earlier, and the price is now attempting to move higher. The projection (blue arrow) suggests a potential bullish continuation targeting the supply zone near 3,394–3,398, with resistance around 3,397 (weak high) and 3,404. Overall, the chart signals a possible short-term upside move if support at the demand zone holds.
免责声明
这些信息和出版物并不意味着也不构成TradingView提供或认可的金融、投资、交易或其它类型的建议或背书。请在使用条款阅读更多信息。
免责声明
这些信息和出版物并不意味着也不构成TradingView提供或认可的金融、投资、交易或其它类型的建议或背书。请在使用条款阅读更多信息。