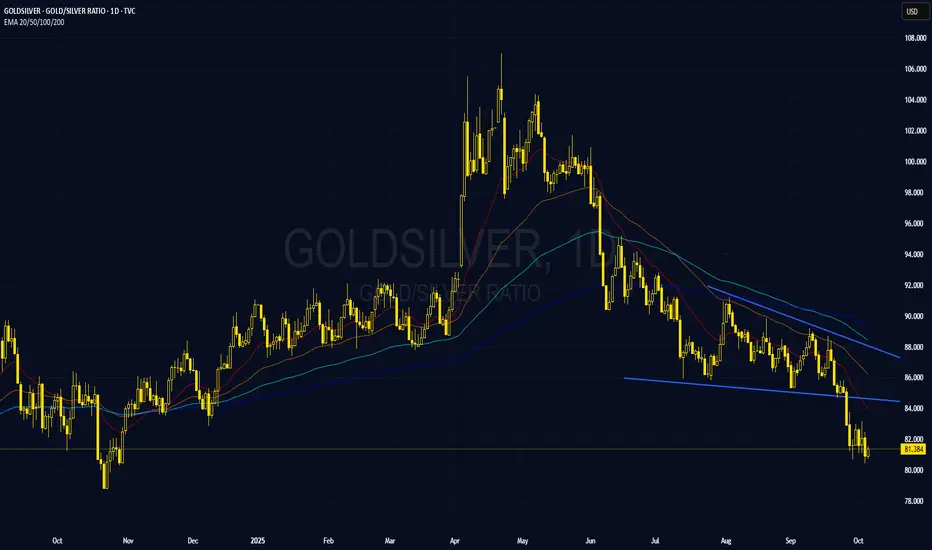
- The gold-to-silver ratio is trading around 81. Although that’s already a decline, it previously fell to around 64 in 2021 and 2016, and even to 31 in 2011. Each time the ratio drops, it typically marks a peak in silver prices during an uptrend.
- Therefore, now is just the beginning of a new down-cycle in the ratio. (Usually, the ratio decreases when precious-metal prices rise.)
- Over the past decade, the gold-to-silver ratio has mostly ranged between 40:1 and 80:1. Readings above ~80 often imply silver is undervalued relative to gold, while below ~40 can suggest gold is undervalued.
- Looking back about a century, the ratio was frequently anchored near 16:1 under bimetallic standards, though it has varied over time.
- Beyond gold’s monetary/jewelry premium, a key driver of silver’s lower price per troy ounce is supply: annual silver mine output is typically 6–14× that of gold, depending on the year.
- In any case, the current ratio of around 80 is considered high.
How to use the ratio effectively - Many investors treat it as a rotation signal between gold and silver. A common approach: buy silver when the ratio is high (typically ≥80:1) and buy gold when the ratio is low (thresholds depend on your preferred lookback).
For illustration: with gold near 3,900 USD per troy ounce, a move in the ratio to 40:1 would imply silver around 97.5 USD per troy ounce (≈double today’s level). - You can also construct a synthetic spread by pairing the two: long silver (XAGUSD) and short gold (XAUUSD) for equal notional value. It’s crucial to match contract size on both legs and rebalance when prices move beyond your tolerance.
Analysis by: Krisada Yoonaisil, Financial Markets Strategist at Exness
免责声明
这些信息和出版物并不意味着也不构成TradingView提供或认可的金融、投资、交易或其它类型的建议或背书。请在使用条款阅读更多信息。
免责声明
这些信息和出版物并不意味着也不构成TradingView提供或认可的金融、投资、交易或其它类型的建议或背书。请在使用条款阅读更多信息。