The Graph (GRT) Token Market Status

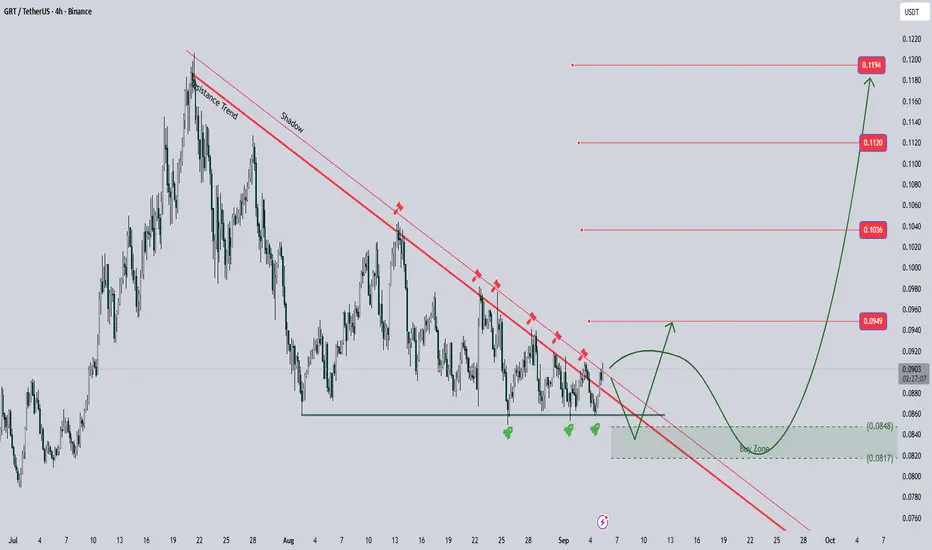
 GRTUSDT is in a downtrend that has been weakening over the past few days. It has found strong support in the price range of $0.0850 - $0.0860. Each time this support holds, it leads to an upward movement toward the downtrend line, where we've seen several fake breakouts.
It's highly probable that the downtrend line will break to the upside, but there are two possible scenarios:
Scenario 1:
A fake breakout to the upside followed by a return to the support line, then a fake breakout of the support line itself, and finally an upward move. In this scenario, the green box would be our buy zone.
Scenario 2:
The downtrend line breaks to the upside with strong momentum today or tomorrow, and then retests the green box, which would again be our buy zone.
In both scenarios, the green box is my designated buy zone, and all major pivots could be potential price targets.
⛔ This is not financial advice; do your own research.
免责声明
这些信息和出版物并不意味着也不构成TradingView提供或认可的金融、投资、交易或其它类型的建议或背书。请在使用条款阅读更多信息。