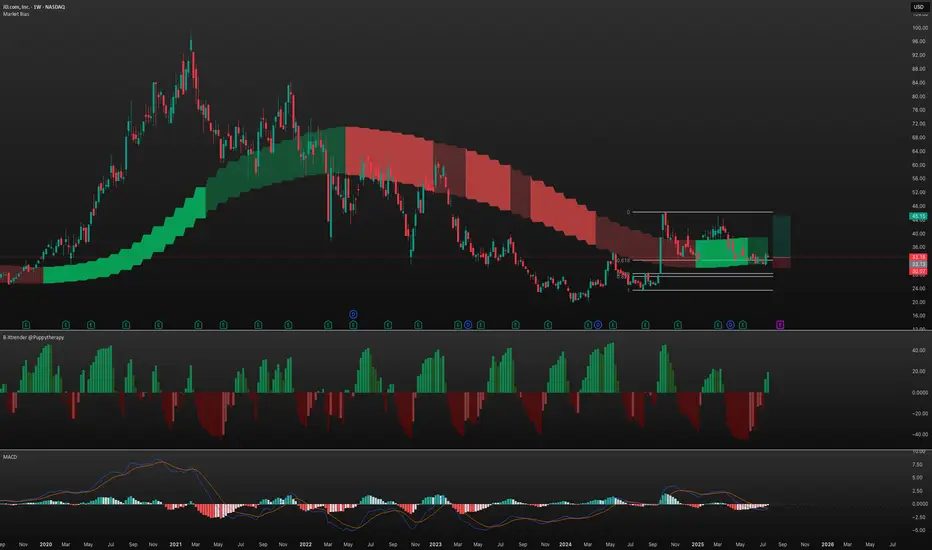
Step 1: Identify the Trend
* Weekly Chart:
* Dark green, price still in the market bias zone (discount zone).
* Bullish trend but not actively expanding yet.
* Daily Chart:
* Dark red, price below the market bias zone.
* Bearish trend but not actively contracting.
Step 2: Identify the Mode
* Compression: April 25 – mid-July 2025.
* Breakout: JD closed above the recent high on July 18, indicating early expansion.
Step 3: Confirm Bullish Accumulation (BX Trender)
* Weekly Chart: Bullish accumulation confirmed, with higher highs since week of July 14.
* Daily Chart: Use for entry timing and share accumulation.
Step 4: Entry Zones
* Institutional Buy Zone: $28.5 – $32.0 (Fib retracement from swing low to high).
* Smart Money Zone: $27.5 – $28.4 (deeper liquidity zone).
Step 5: Take Profit
* 1st Target: 50% at $45(EQ high).
* 2nd Target: Let the rest ride until BX turns red.
* Point of Control (POC): Around $34.
Step 6: Stop Loss
* Below Monthly Market Bias: Around $30 (conservative protection).
JD Trade Setup
* Entry: $28.5 – $32.0
* Stop: ~$30
* 1st TP: $45
* 2nd TP: Trail with BX trender
* Bias: Bullish accumulation phase; early expansion signal confirmed.
Disclaimer: The information provided is for informational and educational purposes only and should not be considered financial advice. Always conduct your own research or consult with a licensed financial advisor before making any investment decisions.
注释
please feel free to comment, let me know what you think or if you notice any mistakes or errors.免责声明
这些信息和出版物并不意味着也不构成TradingView提供或认可的金融、投资、交易或其它类型的建议或背书。请在使用条款阅读更多信息。