As I’ve mentioned in my recent videos, LYFT is one of my top 3 priority stocks for October — and for good reason.
The fundamentals have exploded while the price is still lagging far behind.
🔸 Fundamentals
EPS growth has been massive.
– In March, EPS was up +128% YoY,
– and by June, it jumped to +234% YoY.
EPS has finally moved into positive territory, which is a strong signal.
Revenue continues to rise steadily, and EPS literally took off while the price hasn’t followed yet.
To put it in perspective — when LYFT traded around $60, EPS was negative.
Now, EPS is many times higher, but the stock still trades far below those levels.
Even emission has stopped increasing (we saw –0.25% in June 2025), and the forward P/E is only 15.3,
which is extremely low for this kind of EPS acceleration.
→ In short: LYFT looks deeply undervalued from a fundamental standpoint.

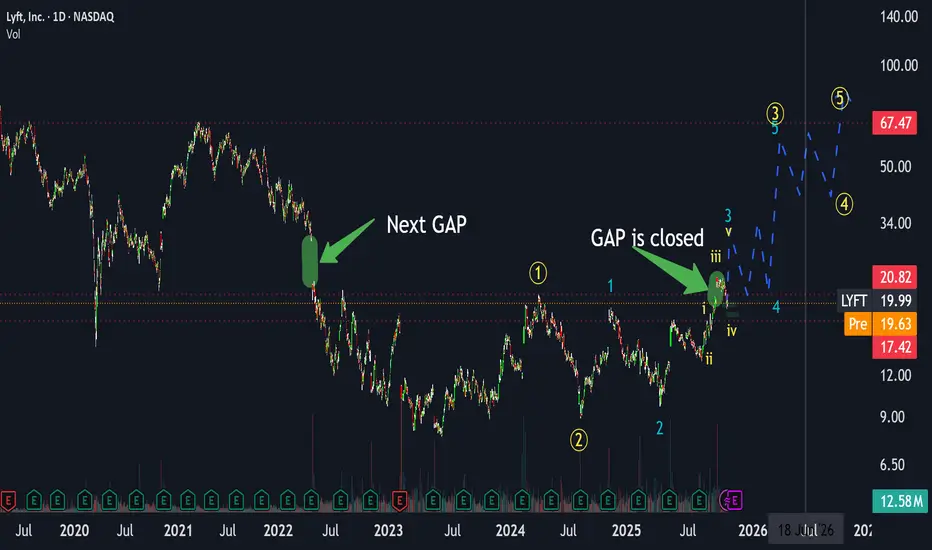
🔸 Technical Picture
Technically, LYFT has just closed a local gap, exactly as expected.
We are currently finishing the fourth sub-wave of the third global wave.
This means the fifth wave is coming next, and the current target around $70 represents only the peak of the third sub-wave — there is still additional upside expected beyond $70.
In the short term, we could see a retest around $18,
followed by the next major move — closing the May 2022 gap near $30, forming the third wave of this cycle.
After that, some consolidation is likely in the $20–30 range,
followed by the next impulse targeting $50–70.
This will be the fourth wave pullback, eventually leading into the fifth wave breakout above $70,
with potential for even higher upside as the global third wave continues.
Summary
Overall, LYFT shows a perfect mix of improving fundamentals and bullish technical structure.
As I’ve said in my latest videos, this stock could take off soon —
and it remains one of my Top 3 picks for October.
Call to Action
If you enjoy this type of analysis or would like me to review other tickers, tap on rocket 🚀 and leave a ticker in the comments.
I’ll make sure to cover your suggestions in upcoming posts soon!
(Full breakdown and context discussed in my recent videos — you can find them via my profile.)
The fundamentals have exploded while the price is still lagging far behind.
🔸 Fundamentals
EPS growth has been massive.
– In March, EPS was up +128% YoY,
– and by June, it jumped to +234% YoY.
EPS has finally moved into positive territory, which is a strong signal.
Revenue continues to rise steadily, and EPS literally took off while the price hasn’t followed yet.
To put it in perspective — when LYFT traded around $60, EPS was negative.
Now, EPS is many times higher, but the stock still trades far below those levels.
Even emission has stopped increasing (we saw –0.25% in June 2025), and the forward P/E is only 15.3,
which is extremely low for this kind of EPS acceleration.
→ In short: LYFT looks deeply undervalued from a fundamental standpoint.
🔸 Technical Picture
Technically, LYFT has just closed a local gap, exactly as expected.
We are currently finishing the fourth sub-wave of the third global wave.
This means the fifth wave is coming next, and the current target around $70 represents only the peak of the third sub-wave — there is still additional upside expected beyond $70.
In the short term, we could see a retest around $18,
followed by the next major move — closing the May 2022 gap near $30, forming the third wave of this cycle.
After that, some consolidation is likely in the $20–30 range,
followed by the next impulse targeting $50–70.
This will be the fourth wave pullback, eventually leading into the fifth wave breakout above $70,
with potential for even higher upside as the global third wave continues.
Summary
Overall, LYFT shows a perfect mix of improving fundamentals and bullish technical structure.
As I’ve said in my latest videos, this stock could take off soon —
and it remains one of my Top 3 picks for October.
Call to Action
If you enjoy this type of analysis or would like me to review other tickers, tap on rocket 🚀 and leave a ticker in the comments.
I’ll make sure to cover your suggestions in upcoming posts soon!
(Full breakdown and context discussed in my recent videos — you can find them via my profile.)
交易开始
Price action did not follow the extension scenario I initially expected for wave 3. Instead, the structure has evolved into a Running Flat, which suggests we are currently forming wave 4.In a Running Flat, wave B exceeds the previous high, which we have already seen, and now we should be completing the final wave C. Since this is a Running Flat, wave C will likely dip below wave A, but there is a key limitation here:
price must not break below 17.50.
A move under 17.50 would invalidate the entire structure.
For now, I am watching the 17.50 area closely. My expectation is that price may test the 200-day MA, currently around 18.20-18.30. A move into the 18 zone followed by a bounce would fit the Running Flat scenario.
As long as 17.50 holds, I still expect the next upward leg, potentially into the 30 area (give or take). But again, 17.50 is the critical level. Hold it -> bullish continuation. Break it -> structure invalid.
FREE Trading Hub
👉 sdk-trading.com/discord
Real-time entries, exits and Q&A. Clean mid–term & long–term analysis. Free to join.
More analysis / forecasts:
sdk-trading.com
👉 sdk-trading.com/discord
Real-time entries, exits and Q&A. Clean mid–term & long–term analysis. Free to join.
More analysis / forecasts:
sdk-trading.com
相关出版物
免责声明
这些信息和出版物并非旨在提供,也不构成TradingView提供或认可的任何形式的财务、投资、交易或其他类型的建议或推荐。请阅读使用条款了解更多信息。