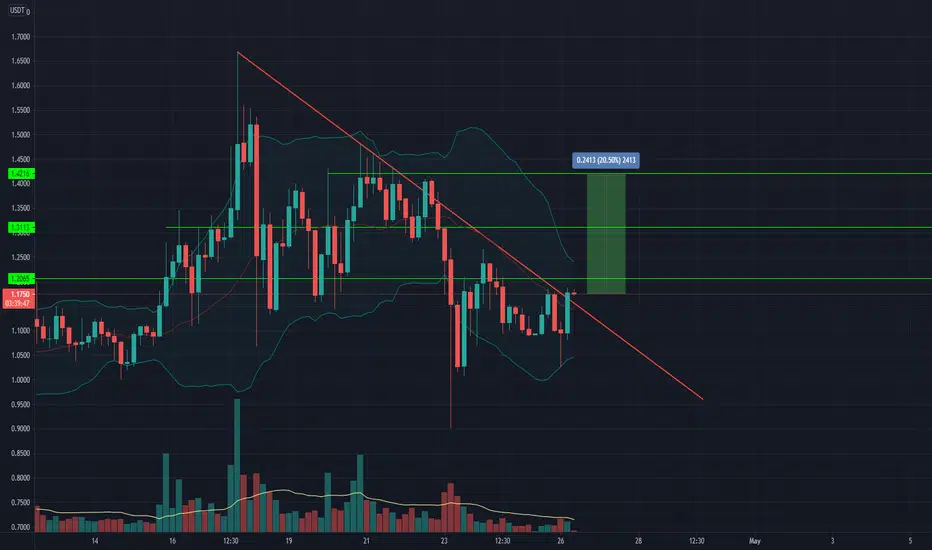
As you can see in the chart, the 4-hour time frame, Mana was able to break its downward trend line after several attempts. (In the previous candlestick, the price closed above the downtrend line).
With the closing of the current 4-hour candle, we can hope that the price will grow up to the specified green resistance levels.
Because in addition to the above, the Bollinger Bands indicator is also interesting:
- Price has tried several times to break the simple moving average in the middle, which finally succeeded in the previous candle with a big and good servant.
免责声明
这些信息和出版物并不意味着也不构成TradingView提供或认可的金融、投资、交易或其它类型的建议或背书。请在使用条款阅读更多信息。
免责声明
这些信息和出版物并不意味着也不构成TradingView提供或认可的金融、投资、交易或其它类型的建议或背书。请在使用条款阅读更多信息。