Overview of the VCP Pattern in MCD
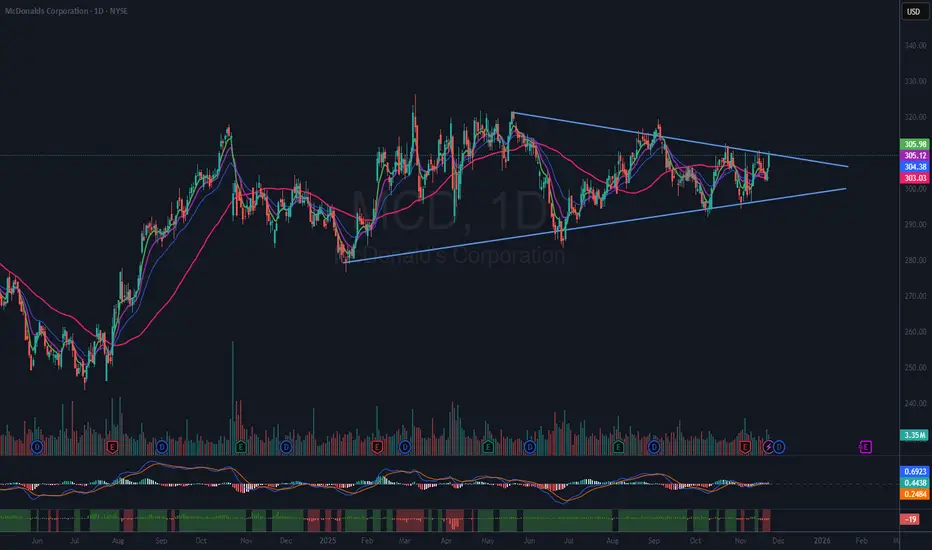
The Volatility Contraction Pattern (VCP), originally named by Mark Minervini, is characterized by a series of price contractions accompanied by declining volume. While Minervini typically focuses on shorter timeframes with more pronounced contractions and volume reductions, the current setup in McDonald's Corporation (MCD) appears to align with the fundamental principles of the VCP.
Recent Volume and Price Action
One notable feature in MCD’s recent trading activity is the relationship between up-day and down-day volumes. Since the release of earnings, the volume on down days has been consistently lower than the volume on up days, suggesting underlying buying support during contractions.
Breakout Attempts and Trading Strategy
Throughout the past month, MCD has made several attempts to break out of its current consolidation range. To monitor potential breakout opportunities, an alert has been set on the upper downtrend line. If the stock manages to break above this trend line, plans are in place to initiate a position, with a stop order set just below the most recent low. This low is also situated near the 50-day moving average (DMA), which may act as a support level.
Risk Management and Reader Guidance
All readers are strongly encouraged to conduct their own analysis and adhere to their individual trading rules. It is crucial to recognize that all investments carry inherent risks. Making informed decisions is essential for prudent capital allocation and long-term success in trading.
Ideas I publish are my own. They are not meant to be investment / trading advice. You are encouraged to do your own due diligence.
I am under no obligation to post any action or update to any idea.
Follow me on "X" where I post more content.
I am under no obligation to post any action or update to any idea.
Follow me on "X" where I post more content.
免责声明
这些信息和出版物并非旨在提供,也不构成TradingView提供或认可的任何形式的财务、投资、交易或其他类型的建议或推荐。请阅读使用条款了解更多信息。