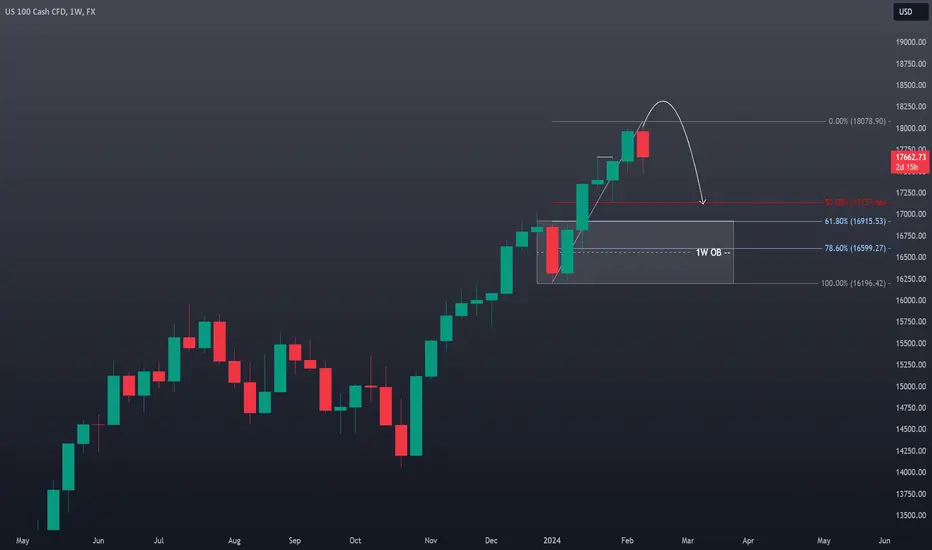
Market Observations: The #NAS100 has maintained a bullish trajectory. However, price action on the monthly timeframe suggest the #US100 is overextended. Additionally, the weekly chart reveals a double top pattern, hinting at a potential retracement down to the 50-61.8% Fibonacci levels. This area could provide the liquidity needed for major market players to fill long orders.
Trade Strategy: Consider an intraday/swing trade short entry following a potential stop run above the current range. Target an initial profit level around the previous lows near 17250, with a secondary target at 17000 (slightly above the 61.8% Fibonacci level on a 1W chart). Implement a well-placed stop-loss order to manage risk effectively.
Disclaimer: This analysis is based on my observations and does not constitute financial advice. Conduct your own independent research and carefully assess your risk tolerance before making investment decisions.
🚀 Winning Scalping Strategy To Beat Market Chaos: ✅ 🚀
👀 🔗 youtu.be/4aI23mzOLJE
🚀 Trade Signals For Your PROP FIRM CHALLENGE: 🔥💰
👀 🔗 youtu.be/nWD69sSxRUM
👉Join Our Free DISCORD:
🔗 discord.com/invite/PcBeCdwVQq
👀 🔗 youtu.be/4aI23mzOLJE
🚀 Trade Signals For Your PROP FIRM CHALLENGE: 🔥💰
👀 🔗 youtu.be/nWD69sSxRUM
👉Join Our Free DISCORD:
🔗 discord.com/invite/PcBeCdwVQq
免责声明
这些信息和出版物并不意味着也不构成TradingView提供或认可的金融、投资、交易或其它类型的建议或背书。请在使用条款阅读更多信息。