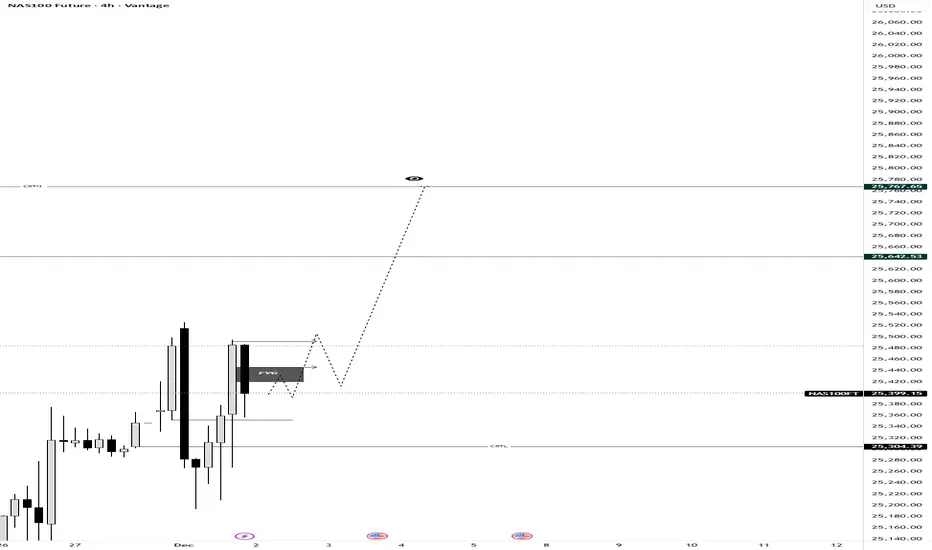
Most traders see random candles; we see a structured story. On this 4H NAS100 chart, we are witnessing a textbook example of Candle Range Theory (CRT) in motion.
If you understand the "Three-Phase Engine" inside every candle, the next move becomes clear.
The 3-Step Logic Behind This Setup:
The Purge (Accumulation): Notice how price dipped to sweep the CRTL (Candle Range Theory Low). This wasn't a random breakdown; it was a Purge Phase designed to grab liquidity and trap retail shorts. By sweeping the low (PL), the market collects the necessary fuel for the reversal.
The Mitigation (The Current Trap): Price has reclaimed the range and is currently mitigating within the FVG (Fair Value Gap). In CRT, this is the Mitigation Phase, where price returns to balance or "Equilibrium" (EQ) to fill imbalances before the real move begins. This phase often confuses traders, but it is simply smart money rebalancing positions.
The Expansion (The Delivery): With the internal liquidity harvested and the imbalance filled, the logic dictates a move toward the CRTH (Candle Range Theory High). This is our Expansion Phase, targeting the "Expansion Level" (EL). The "eye" icon on the chart represents the Draw on Liquidity (DOL)—the magnetic attraction pulling price toward the liquidity pools resting above the highs.
💡 The Lesson: Don't chase the red candles during the purge. Wait for the mitigation. As the theory states:
"The Purge phase creates the opportunity, the Mitigation phase provides the entry, and the Expansion phase delivers the profit".
Are you watching this FVG hold, or are you waiting for a break of structure confirmation? Let me know in the comments! 👇
Greetings,
MrYounity
免责声明
这些信息和出版物并非旨在提供,也不构成TradingView提供或认可的任何形式的财务、投资、交易或其他类型的建议或推荐。请阅读使用条款了解更多信息。