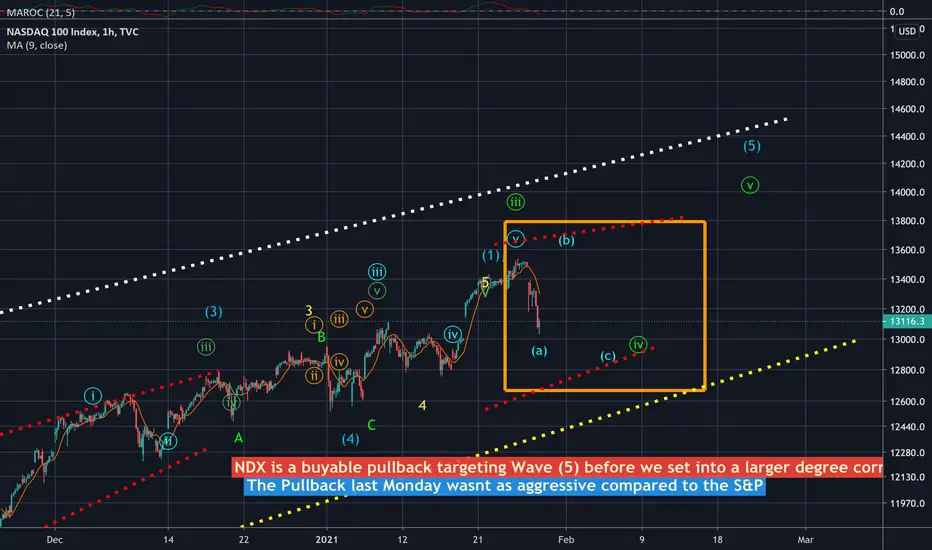
The same predicament exists in the NDX as the SPX. On the hourly chart, we’re seeing a corrective (a), (b), (c) pullback and we may be contained within in the highlighted range in W/ Orange rectangle before completing once terminal move higher into wave v.
免责声明
这些信息和出版物并不意味着也不构成TradingView提供或认可的金融、投资、交易或其它类型的建议或背书。请在使用条款阅读更多信息。
免责声明
这些信息和出版物并不意味着也不构成TradingView提供或认可的金融、投资、交易或其它类型的建议或背书。请在使用条款阅读更多信息。