Detailed Market Structure Breakdown
4-Hour Chart (Macro Trend)
Structure: The Nifty is now in a Corrective Phase, having broken below the aggressive short-term momentum channel (implied from the breakdown seen on 1H/15M charts). The price is trending lower within a descending channel and has closed below the previous day's low. Crucially, the index is hovering just above the critical long-term support of 25,400 - 25,500.
Key Levels:
Major Supply (Resistance): 25,750 - 25,850. This area (the breakdown level and previous swing high) is the key overhead resistance. A "Sell on Rise" strategy is favored in this zone.
Major Demand (Support): 25,400 - 25,500. This is the most critical support zone, aligning with the previous swing high and the 20-day EMA.
Outlook: The short-term bias is Bearish. The failure to hold above 25,600 accelerates selling. A breakdown below 25,450 would trigger a deeper correction.
1-Hour Chart (Intermediate View)
Structure: The 1H chart is strongly bearish, trading in a well-defined descending channel, confirming the short-term correction. The index has slipped below the critical 21 EMA on the daily timeframe, indicating weakness.
Key Levels:
Immediate Resistance: 25,600 (Upper boundary of the descending channel).
Immediate Support: 25,450 (The support of the previous swing high).
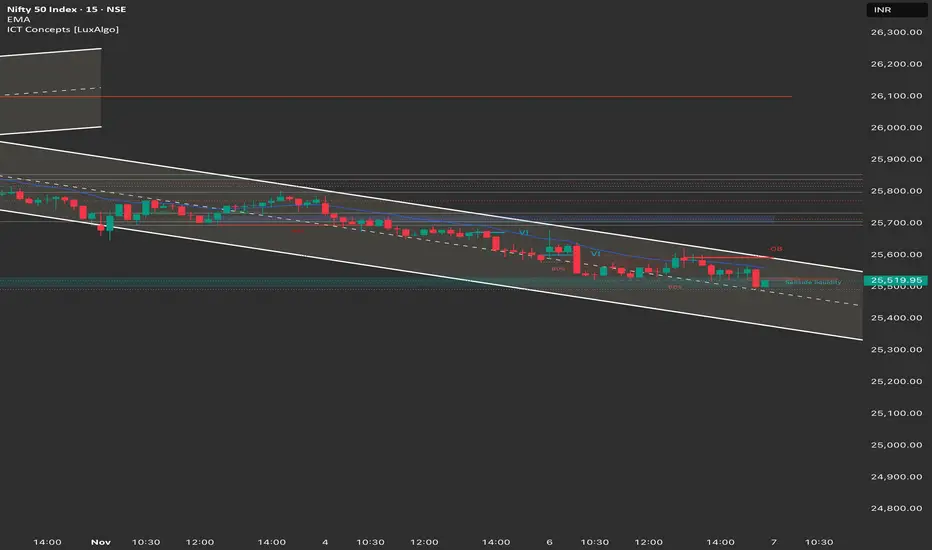
15-Minute Chart (Intraday View)
Structure: The 15M chart confirms the steep descending channel and strong intraday bearish control. The market is making lower highs and lower lows, with the price moving along the lower boundary of the channel.
Key Levels:
Intraday Supply: 25,600 (Upper channel trendline).
Intraday Demand: 25,450.
Outlook: Strongly Bearish.
📈 Structure Analysis & Trade Plan: 7th November
Market Outlook: The Nifty is in a bearish trend, with the structure favoring continuation towards major support. Pine Labs IPO and Groww IPO (subscription ends Nov 7) may influence sentiment in the fintech/broking space. The overall strategy is Sell on Rise or Breakdown.
Bearish Scenario (Primary Plan: Correction Continuation/Sell on Rise)
Justification: The breakdown below 25,600 and the confirmed descending channel favor continuation toward the macro support.
Entry: Short entry on a successful retest and rejection of the 25,600 - 25,650 level (upper channel resistance/FVG) OR Short on a decisive break and 15-minute close below 25,450.
Stop Loss (SL): Place a stop loss above 25,750 (above the last major swing high).
Targets:
T1: 25,450 (Major FVG support).
T2: 25,200 (Next major demand zone).
Bullish Scenario (Counter-Trend/Reversal)
Justification: A short-covering bounce is possible if the market aggressively reclaims the channel.
Trigger: A sustained move and close above 25,750.
Entry: Long entry on a confirmed 15-minute close above 25,750.
Stop Loss (SL): Below 25,600.
Targets:
T1: 25,850 (Major overhead resistance).
T2: 26,000 (Psychological mark/FVG).
Key Levels for Observation:
Immediate Decision Point: 25,450 - 25,600 zone.
Bearish Confirmation: Sustained trade below 25,450.
Bullish Confirmation: A move back above 25,750.
Line in the Sand: 25,450. Below this, the short-term trend weakens further.
4-Hour Chart (Macro Trend)
Structure: The Nifty is now in a Corrective Phase, having broken below the aggressive short-term momentum channel (implied from the breakdown seen on 1H/15M charts). The price is trending lower within a descending channel and has closed below the previous day's low. Crucially, the index is hovering just above the critical long-term support of 25,400 - 25,500.
Key Levels:
Major Supply (Resistance): 25,750 - 25,850. This area (the breakdown level and previous swing high) is the key overhead resistance. A "Sell on Rise" strategy is favored in this zone.
Major Demand (Support): 25,400 - 25,500. This is the most critical support zone, aligning with the previous swing high and the 20-day EMA.
Outlook: The short-term bias is Bearish. The failure to hold above 25,600 accelerates selling. A breakdown below 25,450 would trigger a deeper correction.
1-Hour Chart (Intermediate View)
Structure: The 1H chart is strongly bearish, trading in a well-defined descending channel, confirming the short-term correction. The index has slipped below the critical 21 EMA on the daily timeframe, indicating weakness.
Key Levels:
Immediate Resistance: 25,600 (Upper boundary of the descending channel).
Immediate Support: 25,450 (The support of the previous swing high).
15-Minute Chart (Intraday View)
Structure: The 15M chart confirms the steep descending channel and strong intraday bearish control. The market is making lower highs and lower lows, with the price moving along the lower boundary of the channel.
Key Levels:
Intraday Supply: 25,600 (Upper channel trendline).
Intraday Demand: 25,450.
Outlook: Strongly Bearish.
📈 Structure Analysis & Trade Plan: 7th November
Market Outlook: The Nifty is in a bearish trend, with the structure favoring continuation towards major support. Pine Labs IPO and Groww IPO (subscription ends Nov 7) may influence sentiment in the fintech/broking space. The overall strategy is Sell on Rise or Breakdown.
Bearish Scenario (Primary Plan: Correction Continuation/Sell on Rise)
Justification: The breakdown below 25,600 and the confirmed descending channel favor continuation toward the macro support.
Entry: Short entry on a successful retest and rejection of the 25,600 - 25,650 level (upper channel resistance/FVG) OR Short on a decisive break and 15-minute close below 25,450.
Stop Loss (SL): Place a stop loss above 25,750 (above the last major swing high).
Targets:
T1: 25,450 (Major FVG support).
T2: 25,200 (Next major demand zone).
Bullish Scenario (Counter-Trend/Reversal)
Justification: A short-covering bounce is possible if the market aggressively reclaims the channel.
Trigger: A sustained move and close above 25,750.
Entry: Long entry on a confirmed 15-minute close above 25,750.
Stop Loss (SL): Below 25,600.
Targets:
T1: 25,850 (Major overhead resistance).
T2: 26,000 (Psychological mark/FVG).
Key Levels for Observation:
Immediate Decision Point: 25,450 - 25,600 zone.
Bearish Confirmation: Sustained trade below 25,450.
Bullish Confirmation: A move back above 25,750.
Line in the Sand: 25,450. Below this, the short-term trend weakens further.
免责声明
这些信息和出版物并不意味着也不构成TradingView提供或认可的金融、投资、交易或其它类型的建议或背书。请在使用条款阅读更多信息。
免责声明
这些信息和出版物并不意味着也不构成TradingView提供或认可的金融、投资、交易或其它类型的建议或背书。请在使用条款阅读更多信息。