🔎 Market Structure Analysis
4H Chart (Higher Timeframe Bias)
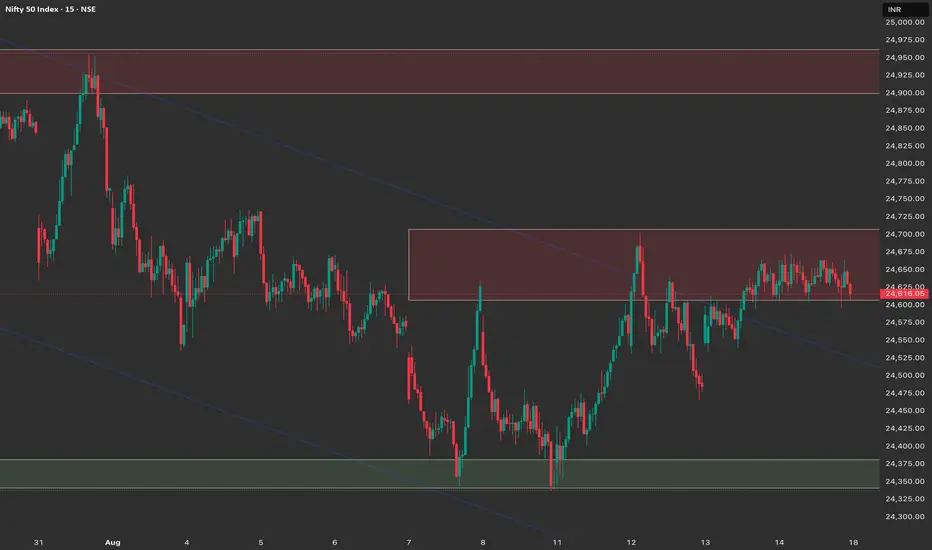
Trend: Price is still in a broader downtrend channel, though it recently attempted a bounce.
Key Resistance Zone: 24,650 – 24,700 (current rejection zone).
Support Zone: 24,350 – 24,400 (green demand zone).
Observation: Price has tested resistance and is struggling to break above. Sellers are defending this supply area strongly.
1H Chart (Intermediate View)
Trend: Recent up-move has stalled at 24,650–24,700 supply.
Structure: Multiple wicks into the supply zone showing rejection.
Support: 24,400 remains crucial. If broken, momentum may extend downside.
Bias: Sideways to bearish until a clear breakout.
15M Chart (Execution View)
Current Action: Price consolidating within the 24,600–24,700 range.
Intraday Resistance: 24,680–24,700 (supply overhead).
Intraday Support: 24,500–24,550 minor zone, then 24,400 major zone.
Setup: Small range-bound moves, awaiting breakout for momentum.
📌 Trade Plan for 18th August (Monday)
1. Bullish Scenario
Trigger: Sustained breakout above 24,700 with volume.
Upside Targets:
24,850 (first target)
25,000 (next target, major supply)
Stop-Loss: Below 24,600 (re-entry into range invalidates breakout).
2. Bearish Scenario
Trigger: Rejection from 24,650–24,700 supply and breakdown below 24,500.
Downside Targets:
24,400 (first support)
24,300–24,250 (extended target, demand zone)
Stop-Loss: Above 24,700 (if shorting from supply zone).
3. Range-Bound / Neutral Scenario
If price remains between 24,500–24,700, avoid over-trading.
Focus on quick scalps inside the range until a clean breakout confirms direction.
🎯 Key Levels to Watch
Resistance Zones: 24,650 – 24,700 | 24,850 | 25,000
Support Zones: 24,500 | 24,400 | 24,300
✅ Summary:
Nifty is at a make-or-break zone. Monday’s plan is simple:
Above 24,700 → look for longs targeting 24,850–25,000.
Below 24,500 → look for shorts targeting 24,400–24,300.
Stay neutral if trapped inside 24,500–24,700 range.
4H Chart (Higher Timeframe Bias)
Trend: Price is still in a broader downtrend channel, though it recently attempted a bounce.
Key Resistance Zone: 24,650 – 24,700 (current rejection zone).
Support Zone: 24,350 – 24,400 (green demand zone).
Observation: Price has tested resistance and is struggling to break above. Sellers are defending this supply area strongly.
1H Chart (Intermediate View)
Trend: Recent up-move has stalled at 24,650–24,700 supply.
Structure: Multiple wicks into the supply zone showing rejection.
Support: 24,400 remains crucial. If broken, momentum may extend downside.
Bias: Sideways to bearish until a clear breakout.
15M Chart (Execution View)
Current Action: Price consolidating within the 24,600–24,700 range.
Intraday Resistance: 24,680–24,700 (supply overhead).
Intraday Support: 24,500–24,550 minor zone, then 24,400 major zone.
Setup: Small range-bound moves, awaiting breakout for momentum.
📌 Trade Plan for 18th August (Monday)
1. Bullish Scenario
Trigger: Sustained breakout above 24,700 with volume.
Upside Targets:
24,850 (first target)
25,000 (next target, major supply)
Stop-Loss: Below 24,600 (re-entry into range invalidates breakout).
2. Bearish Scenario
Trigger: Rejection from 24,650–24,700 supply and breakdown below 24,500.
Downside Targets:
24,400 (first support)
24,300–24,250 (extended target, demand zone)
Stop-Loss: Above 24,700 (if shorting from supply zone).
3. Range-Bound / Neutral Scenario
If price remains between 24,500–24,700, avoid over-trading.
Focus on quick scalps inside the range until a clean breakout confirms direction.
🎯 Key Levels to Watch
Resistance Zones: 24,650 – 24,700 | 24,850 | 25,000
Support Zones: 24,500 | 24,400 | 24,300
✅ Summary:
Nifty is at a make-or-break zone. Monday’s plan is simple:
Above 24,700 → look for longs targeting 24,850–25,000.
Below 24,500 → look for shorts targeting 24,400–24,300.
Stay neutral if trapped inside 24,500–24,700 range.
免责声明
这些信息和出版物并不意味着也不构成TradingView提供或认可的金融、投资、交易或其它类型的建议或背书。请在使用条款阅读更多信息。
免责声明
这些信息和出版物并不意味着也不构成TradingView提供或认可的金融、投资、交易或其它类型的建议或背书。请在使用条款阅读更多信息。