Based on the charts and market data from Monday, September 22, the Nifty has experienced a significant correction, breaking below a key support level. The market sentiment has shifted from strongly bullish to cautiously bearish in the short term.
Detailed Market Structure Breakdown
4 Hour Chart (Macro Trend)
Structure: The long-term trend remains bullish, as the index is still trading above its August lows. However, Monday's strong bearish candle, which broke below the rising channel, indicates a significant shift in the immediate trend. The bulls' control has been challenged, and a deeper correction is now more probable.
Key Levels:
Major Supply (Resistance): 25,500-25,600. This level has proven to be a very strong supply zone, rejecting the price on multiple occasions.
Major Demand (Support): The most critical support is the 25,050-25,100 zone. This area, which includes a prior breakout level and a FVG (Fair Value Gap), is now the key "line in the sand" for the long-term bullish trend. A break below this would signal a major trend reversal.
1-Hour Chart (Intermediate View)
Structure: The 1H chart shows a clear MSS (Market Structure Shift) to the downside. The price has broken below the lower trendline of the rising channel and its immediate support, confirming the short-term bearish bias. The index is now making lower highs and lower lows.
Key Levels:
Immediate Resistance: The 25,300 level, which was a strong support, has now become a crucial resistance. Any bounce is likely to be met with selling pressure in this zone.
Immediate Support: The next key support level is the 25,200 mark. This is a psychological level that was tested and broken on Monday. A retest of this level is likely.
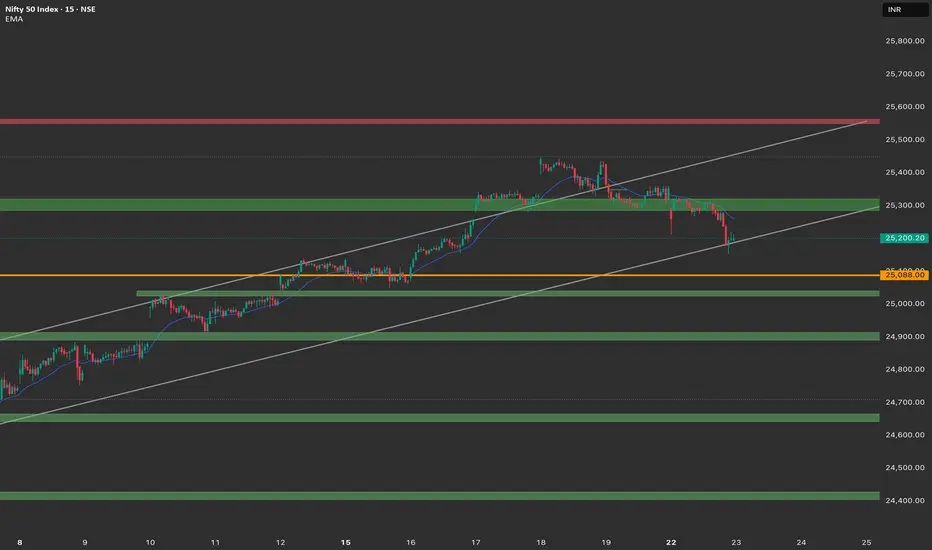
15-Minute Chart (Intraday View)
Structure: The 15M chart provides a clearer picture of the intraday fall. The price is showing a small consolidation after the sharp decline. This is likely a pause before the next move.
Key Levels:
Intraday Supply: The 25,250 area, which is the high of the recent consolidation.
Intraday Demand: The low of the recent consolidation and the intraday low, near 25,200.
Outlook: The intraday bias is bearish. The market is likely to continue its downward movement unless it can reclaim the 25,300 resistance level.
Trade Plan: 23rd September
Market Outlook: The market is now in a short-term bearish phase. A "sell on rise" strategy seems more favorable, but a strong reversal from a key support level is also a possibility.
Bearish Scenario (Primary Plan)
Justification: The market has shown a clear change in structure with a breakdown of key levels. The path of least resistance is to the downside.
Entry: Look for a short entry if the price retests the 25,300 level and shows signs of rejection with a bearish candlestick pattern. Alternatively, a breakdown and 15-minute close below 25,200 would trigger a short entry.
Stop Loss (SL): Place a stop loss above 25,350.
Targets:
T1: 25,100 (Next major support).
T2: 25,050 (Psychological level and strong demand zone).
Bullish Scenario (Counter-Trend Plan)
Justification: This is a counter-trend plan and should be approached with caution. It is based on the possibility of a strong bounce from a key support level.
Trigger: A strong bullish reversal candle (e.g., a hammer or engulfing pattern) near the 25,100 - 25,050 demand zone.
Entry: Long entry on a confirmed bounce from the demand zone.
Stop Loss (SL): Below 25,000.
Targets:
T1: 25,250 (Intraday resistance).
T2: 25,400 (Recent swing high).
Key Levels for Observation:
Immediate Decision Point: The 25,200 - 25,300 zone.
Bearish Confirmation: A break and sustained move below 25,200.
Bullish Confirmation: A recapture of the 25,300 level.
Line in the Sand: The 25,050 - 25,100 zone. The overall bullish trend is in jeopardy if this level is decisively broken.
Detailed Market Structure Breakdown
4 Hour Chart (Macro Trend)
Structure: The long-term trend remains bullish, as the index is still trading above its August lows. However, Monday's strong bearish candle, which broke below the rising channel, indicates a significant shift in the immediate trend. The bulls' control has been challenged, and a deeper correction is now more probable.
Key Levels:
Major Supply (Resistance): 25,500-25,600. This level has proven to be a very strong supply zone, rejecting the price on multiple occasions.
Major Demand (Support): The most critical support is the 25,050-25,100 zone. This area, which includes a prior breakout level and a FVG (Fair Value Gap), is now the key "line in the sand" for the long-term bullish trend. A break below this would signal a major trend reversal.
1-Hour Chart (Intermediate View)
Structure: The 1H chart shows a clear MSS (Market Structure Shift) to the downside. The price has broken below the lower trendline of the rising channel and its immediate support, confirming the short-term bearish bias. The index is now making lower highs and lower lows.
Key Levels:
Immediate Resistance: The 25,300 level, which was a strong support, has now become a crucial resistance. Any bounce is likely to be met with selling pressure in this zone.
Immediate Support: The next key support level is the 25,200 mark. This is a psychological level that was tested and broken on Monday. A retest of this level is likely.
15-Minute Chart (Intraday View)
Structure: The 15M chart provides a clearer picture of the intraday fall. The price is showing a small consolidation after the sharp decline. This is likely a pause before the next move.
Key Levels:
Intraday Supply: The 25,250 area, which is the high of the recent consolidation.
Intraday Demand: The low of the recent consolidation and the intraday low, near 25,200.
Outlook: The intraday bias is bearish. The market is likely to continue its downward movement unless it can reclaim the 25,300 resistance level.
Trade Plan: 23rd September
Market Outlook: The market is now in a short-term bearish phase. A "sell on rise" strategy seems more favorable, but a strong reversal from a key support level is also a possibility.
Bearish Scenario (Primary Plan)
Justification: The market has shown a clear change in structure with a breakdown of key levels. The path of least resistance is to the downside.
Entry: Look for a short entry if the price retests the 25,300 level and shows signs of rejection with a bearish candlestick pattern. Alternatively, a breakdown and 15-minute close below 25,200 would trigger a short entry.
Stop Loss (SL): Place a stop loss above 25,350.
Targets:
T1: 25,100 (Next major support).
T2: 25,050 (Psychological level and strong demand zone).
Bullish Scenario (Counter-Trend Plan)
Justification: This is a counter-trend plan and should be approached with caution. It is based on the possibility of a strong bounce from a key support level.
Trigger: A strong bullish reversal candle (e.g., a hammer or engulfing pattern) near the 25,100 - 25,050 demand zone.
Entry: Long entry on a confirmed bounce from the demand zone.
Stop Loss (SL): Below 25,000.
Targets:
T1: 25,250 (Intraday resistance).
T2: 25,400 (Recent swing high).
Key Levels for Observation:
Immediate Decision Point: The 25,200 - 25,300 zone.
Bearish Confirmation: A break and sustained move below 25,200.
Bullish Confirmation: A recapture of the 25,300 level.
Line in the Sand: The 25,050 - 25,100 zone. The overall bullish trend is in jeopardy if this level is decisively broken.
免责声明
这些信息和出版物并非旨在提供,也不构成TradingView提供或认可的任何形式的财务、投资、交易或其他类型的建议或推荐。请阅读使用条款了解更多信息。
免责声明
这些信息和出版物并非旨在提供,也不构成TradingView提供或认可的任何形式的财务、投资、交易或其他类型的建议或推荐。请阅读使用条款了解更多信息。