📊 Market Structure Analysis
4H Timeframe:
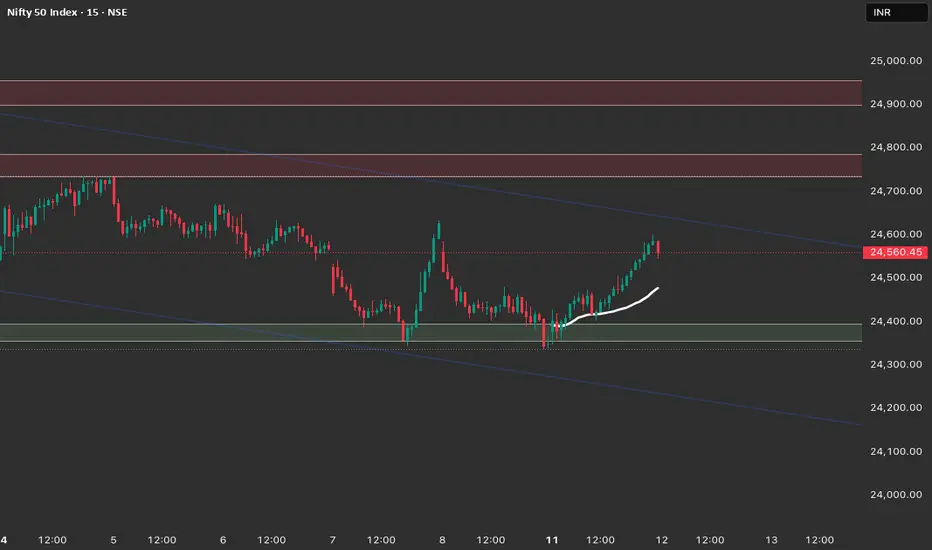
Still within the broader downtrend channel, but price has shown strength after a bounce from 24,350 demand zone.
Multiple FVGs above — particularly around 24,640–24,700 — acting as supply.
EMA 24,645 is immediate dynamic resistance.
BOS seen on smaller TF, but 4H needs a close above 24,650 for trend shift confirmation.
1H Timeframe:
Clear MSS from lows at 24,350 with strong bullish impulsive move.
Price reached prior OB at 24,560–24,600, showing rejection wicks.
If price sustains above 24,500, next liquidity grab possible towards 24,700–24,750.
Failure to hold 24,500 will pull price back into 24,430–24,400 zone.
15M Timeframe:
Structure bullish in short term, but at HTF resistance.
Minor FVG left behind at 24,510–24,520 that could get filled before continuation.
Intraday scalpers should watch for reaction here — rejection = short scalp, hold = continuation.
🎯 Trade Plan for 12th Aug (Nifty)
🔼 Long Setup (Preferred if 24,500 holds):
Entry: Retest of 24,510–24,520 (FVG fill) with bullish reversal candle.
Stop Loss: Below 24,460.
Targets:
T1: 24,600 (intraday supply)
T2: 24,700–24,750 (liquidity sweep level).
🔻 Short Setup (If rejection at 24,600–24,650):
Entry: On bearish rejection from OB / supply zone.
Stop Loss: Above 24,670.
Targets:
T1: 24,500
T2: 24,430–24,400 (demand zone).
⛔ No-Trade Zones:
Between 24,500–24,530 if price consolidates sideways.
Inside 24,430–24,460 until a clean breakout — choppy action likely.
4H Timeframe:
Still within the broader downtrend channel, but price has shown strength after a bounce from 24,350 demand zone.
Multiple FVGs above — particularly around 24,640–24,700 — acting as supply.
EMA 24,645 is immediate dynamic resistance.
BOS seen on smaller TF, but 4H needs a close above 24,650 for trend shift confirmation.
1H Timeframe:
Clear MSS from lows at 24,350 with strong bullish impulsive move.
Price reached prior OB at 24,560–24,600, showing rejection wicks.
If price sustains above 24,500, next liquidity grab possible towards 24,700–24,750.
Failure to hold 24,500 will pull price back into 24,430–24,400 zone.
15M Timeframe:
Structure bullish in short term, but at HTF resistance.
Minor FVG left behind at 24,510–24,520 that could get filled before continuation.
Intraday scalpers should watch for reaction here — rejection = short scalp, hold = continuation.
🎯 Trade Plan for 12th Aug (Nifty)
🔼 Long Setup (Preferred if 24,500 holds):
Entry: Retest of 24,510–24,520 (FVG fill) with bullish reversal candle.
Stop Loss: Below 24,460.
Targets:
T1: 24,600 (intraday supply)
T2: 24,700–24,750 (liquidity sweep level).
🔻 Short Setup (If rejection at 24,600–24,650):
Entry: On bearish rejection from OB / supply zone.
Stop Loss: Above 24,670.
Targets:
T1: 24,500
T2: 24,430–24,400 (demand zone).
⛔ No-Trade Zones:
Between 24,500–24,530 if price consolidates sideways.
Inside 24,430–24,460 until a clean breakout — choppy action likely.
免责声明
这些信息和出版物并不意味着也不构成TradingView提供或认可的金融、投资、交易或其它类型的建议或背书。请在使用条款阅读更多信息。
免责声明
这些信息和出版物并不意味着也不构成TradingView提供或认可的金融、投资、交易或其它类型的建议或背书。请在使用条款阅读更多信息。