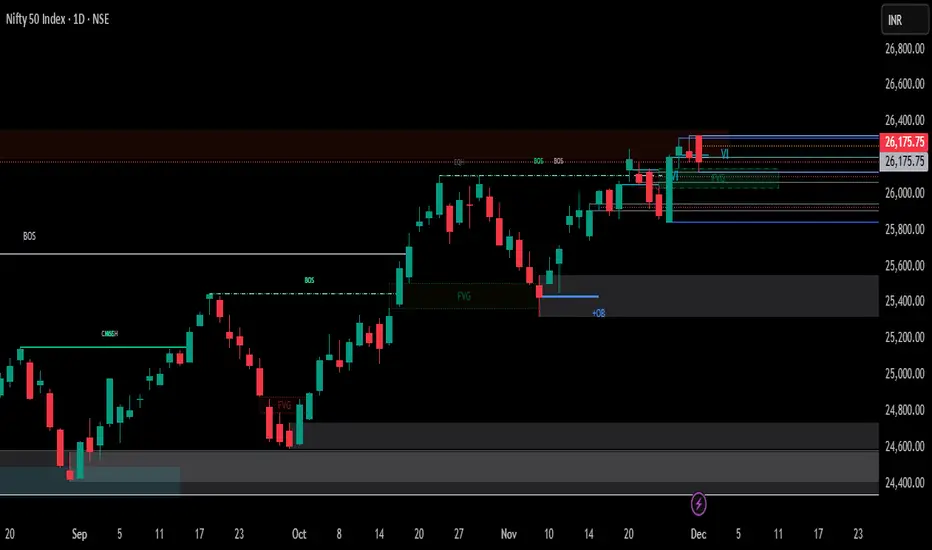
Key Observations from Your Markups (ICT Style):
1. Price is sitting inside a 4H FVG (26,110–26,170 zone)
This is acting as intraday demand / discount region.
Price bounced here previously and is testing it again.
2. Multiple PDH levels above + Weak High at ~26,320–26,350
This cluster suggests **liquidity resting above.
If price reclaims PDH → expect a sweep toward the weak high.
3. PDL is protected (~26,070–26,090)
Clean liquidity pool below.
A sweep into PDL + FVG confluence gives high-probability long setup.
4. Daily chart shows rejection from the supply zone (26,300–26,380)
But the structure is still **bullish BOS → continuation** unless 25,950 breaks.
---
📌Tomorrow’s Probable Scenarios
🟢 Bullish Setup (Higher Probability)
Entry Zone:
➡️ 26,080–26,120 (PDL + 4H FVG + discount)
Entry Trigger:
W-pattern
BOS on 5m/15m
Stop-run below today’s low
Targets:
1. 26,240
2. 26,310 (PDH)
3. 26,350–26,380 (Weak High / liquidity sweep)
Stoploss:
➡️ Below 25,980 (structure invalidation + 4H FVG break)
---
🔴 Bearish Setup (If 26,300 is rejected again)
Entry Zone:
➡️ 26,300–26,350 (weak high + PDH cluster)
Targets:
1. 26,180
2. 26,110 (FVG midpoint)
3. 25,980 (PDL & liquidity)
Stoploss:
➡️ Above 26,380 (clean invalidation)
相关出版物
免责声明
这些信息和出版物并非旨在提供,也不构成TradingView提供或认可的任何形式的财务、投资、交易或其他类型的建议或推荐。请阅读使用条款了解更多信息。