Detailed Market Structure Breakdown
4-Hour Chart (Macro Trend)
Structure: The Nifty is now in a confirmed bullish bounce phase. The decisive move on Wednesday (Oct 1st) and the follow-through on Friday (Oct 3rd) have broken the steep descending channel shown in your charts. The market is now trading within a clear ascending channel, and the recent low at 24,600 looks like a significant bottom for the correction.
Key Levels:
Major Supply (Resistance): 25,000 - 25,150. This area is the next significant hurdle, aligning with the psychological 25,000 mark and prior consolidation/supply zones.
Major Demand (Support): 24,750 - 24,800. This area, which includes a FVG (Fair Value Gap) and the lower trendline of the new ascending channel, is the key support.
Outlook: The medium-term bias has shifted to cautiously bullish. The strategy is firmly "Buy on Dips" as long as the price holds above 24,700.
1-Hour Chart (Intermediate View)
Structure: The 1H chart shows an unmistakable Break of Structure (BOS) on the upside. The price has established a pattern of higher highs and higher lows and is confidently moving within the new ascending channel.
Key Levels:
Immediate Resistance: 24,950 (The high of Friday's consolidation).
Immediate Support: 24,800 (Lower boundary of the new ascending channel).
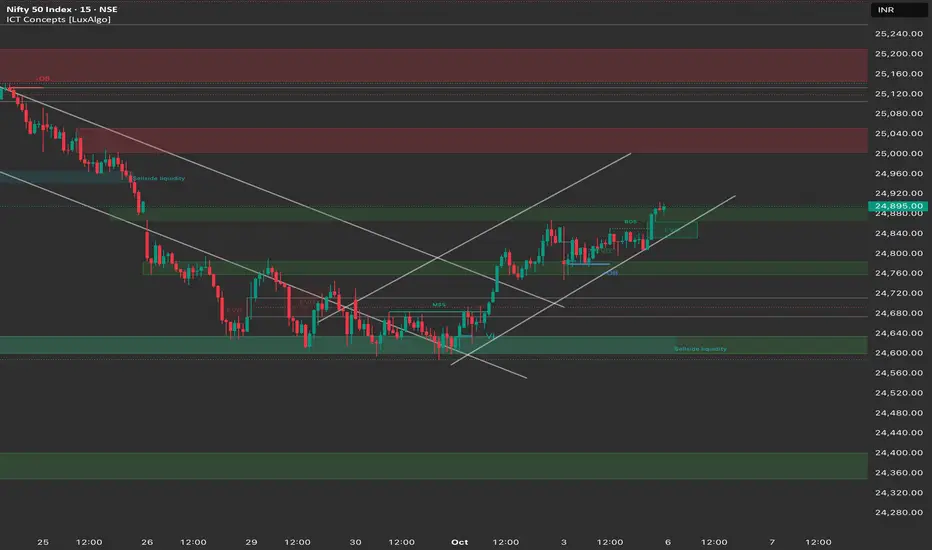
15-Minute Chart (Intraday View)
Structure: The 15M chart shows a clean continuation of the bullish momentum. After breaking out of the descending channel, the index consolidated beautifully in a tight flag pattern and moved higher. The market closed near its high, indicating strong control by the bulls.
Key Levels:
Intraday Supply: 24,950.
Intraday Demand: 24,850 - 24,800.
Outlook: Strongly Bullish.
📈 Trade Plan (Monday, 6th October)
Market Outlook: The Nifty is in a strong bounce phase with a clear bullish structure. The primary strategy will be to buy on dips or buy on continuation.
Bullish Scenario (Primary Plan)
Justification: The market structure is bullish on all timeframes, supported by the RBI catalyst and follow-through buying. The momentum favors a break of 25,000.
Entry: Long entry on a decisive break and 15-minute candle close above 24,950. Alternatively, look for a dip entry near 24,800 (the channel and FVG support zone).
Stop Loss (SL): Place a stop loss below 24,750 (below the key support and rising trendline).
Targets:
T1: 25,050 (Psychological resistance).
T2: 25,150 (Major supply zone).
T3: 25,250 (Extension target).
Bearish Scenario (Counter-Trend Plan)
Justification: This high-risk, counter-trend plan only becomes valid if the rally fails dramatically.
Trigger: A decisive break and 1-hour candle close below 24,700.
Entry: Short entry below 24,700.
Stop Loss (SL): Above 24,850 (above the rising trendline).
Targets:
T1: 24,600 (Recent swing low).
T2: 24,400 (Deeper demand zone).
Key Levels for Observation:
Immediate Decision Point: 24,900 - 25,000 zone.
Bullish Confirmation: A break and sustained move above 25,000.
Bearish Warning: A break below 24,750 suggests a failure of the bounce.
Line in the Sand: 24,700. Below this level, the short-term bias shifts back to neutral-to-bearish.
免责声明
这些信息和出版物并不意味着也不构成TradingView提供或认可的金融、投资、交易或其它类型的建议或背书。请在使用条款阅读更多信息。
免责声明
这些信息和出版物并不意味着也不构成TradingView提供或认可的金融、投资、交易或其它类型的建议或背书。请在使用条款阅读更多信息。