Current Context: Nifty50 trading near 25,400, a tested support zone. Market structure suggests two potential scenarios based on price reaction at this level.
🔍 Key Levels to Monitor
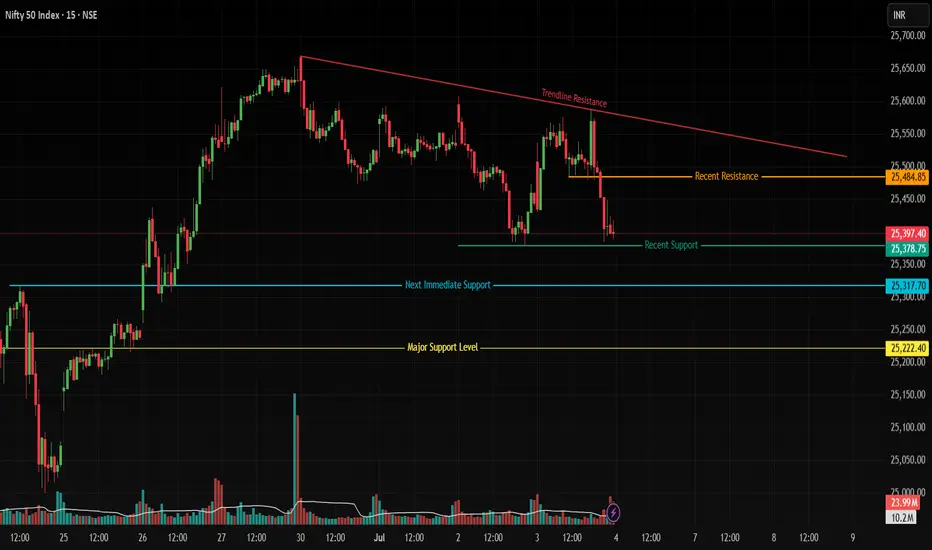
Immediate Support: 25,400 (recent price anchor)
Next Supports: 25,300 (minor swing low) → 25,220 (major historical base)
Near-Term Resistance: 25,480 (recent swing high)
Trendline Resistance: 25,575 (drawn from June 30 highs)
📈 Bullish Scenario Framework
Observation Criteria: A robust green candle closing above 25,400.
Potential Structure:
Break above 25,480, Recent Resistance (Orange line) may signal momentum toward 25,575 trendline resistance.
Note: Volume confirmation could strengthen validity.
📉 Bearish Scenario Framework
Observation Criteria: Strong red candle closing below 25,400.
Potential Structure:
Sustained move below 25,400 opens 25,300 zone (Blue Line) as next interest area.
25,220 becomes focal point if 25,300 fails to hold.
🔎 Why This Matters
25,400 Significance: Acts as a hinge between recent consolidation (bullish) and distribution (bearish).
Volume & Candles: Strength/weakness in breakouts may be validated by volume spikes.
Trendline Context: 25,575 aligns with a 4-session descending trendline (tested twice).
⚠️ Disclaimer
This idea highlights observed market structure levels and is not trading advice. It does not constitute a recommendation to buy/sell securities or any financial instrument. Market conditions change rapidly; always conduct independent analysis and consider your risk tolerance before trading. Past performance is not indicative of future results.
🔍 Key Levels to Monitor
Immediate Support: 25,400 (recent price anchor)
Next Supports: 25,300 (minor swing low) → 25,220 (major historical base)
Near-Term Resistance: 25,480 (recent swing high)
Trendline Resistance: 25,575 (drawn from June 30 highs)
📈 Bullish Scenario Framework
Observation Criteria: A robust green candle closing above 25,400.
Potential Structure:
Break above 25,480, Recent Resistance (Orange line) may signal momentum toward 25,575 trendline resistance.
Note: Volume confirmation could strengthen validity.
📉 Bearish Scenario Framework
Observation Criteria: Strong red candle closing below 25,400.
Potential Structure:
Sustained move below 25,400 opens 25,300 zone (Blue Line) as next interest area.
25,220 becomes focal point if 25,300 fails to hold.
🔎 Why This Matters
25,400 Significance: Acts as a hinge between recent consolidation (bullish) and distribution (bearish).
Volume & Candles: Strength/weakness in breakouts may be validated by volume spikes.
Trendline Context: 25,575 aligns with a 4-session descending trendline (tested twice).
⚠️ Disclaimer
This idea highlights observed market structure levels and is not trading advice. It does not constitute a recommendation to buy/sell securities or any financial instrument. Market conditions change rapidly; always conduct independent analysis and consider your risk tolerance before trading. Past performance is not indicative of future results.
免责声明
这些信息和出版物并不意味着也不构成TradingView提供或认可的金融、投资、交易或其它类型的建议或背书。请在使用条款阅读更多信息。
免责声明
这些信息和出版物并不意味着也不构成TradingView提供或认可的金融、投资、交易或其它类型的建议或背书。请在使用条款阅读更多信息。