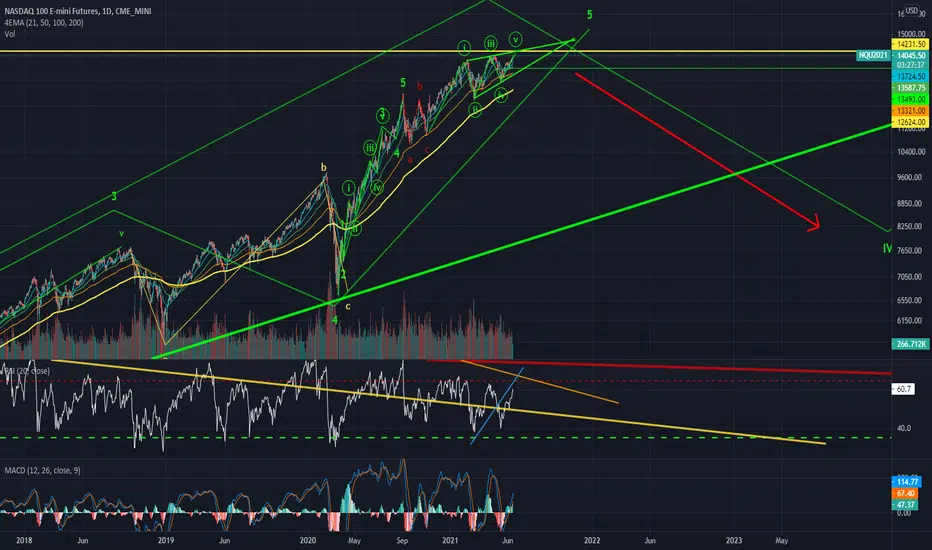
Tracking this formation as an ending diagonal.
This might be THE ending diagonal.
The ending point can be a higher high or lower one.
Many times you'll see a bump up above the top of the diagonal before it crashes back through.
*Note: This is the exact same formation Bitcoin had a few months ago before it crashed 50%. The relation is palpable.
I see Bitcoin as the honest player in the game as far as price action and patterns go. Look at the two charts.
Diagonal remains valid unless be break above 15,000.
注释
免责声明
这些信息和出版物并不意味着也不构成TradingView提供或认可的金融、投资、交易或其它类型的建议或背书。请在使用条款阅读更多信息。
免责声明
这些信息和出版物并不意味着也不构成TradingView提供或认可的金融、投资、交易或其它类型的建议或背书。请在使用条款阅读更多信息。