教学
Symmetrical triangle tutorial - live example of a short setup
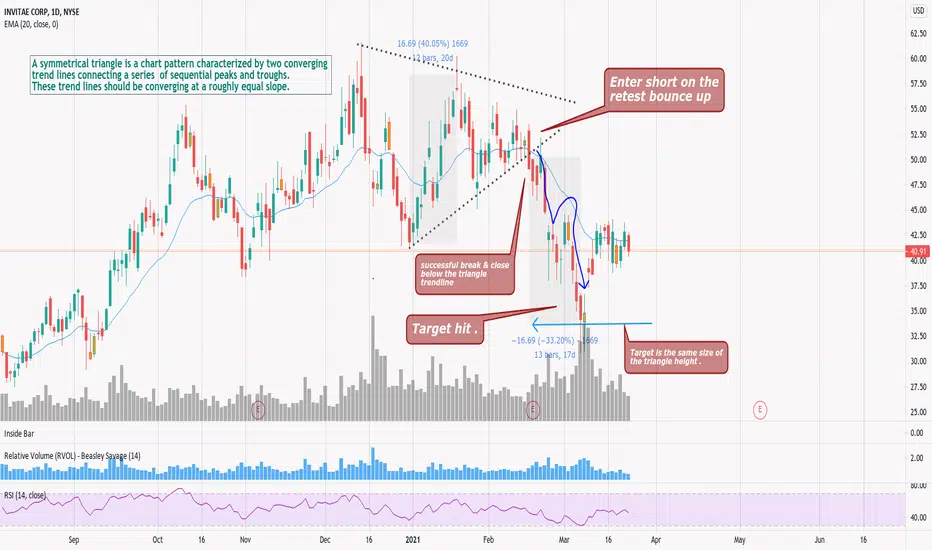
A symmetrical triangle is a chart pattern characterized by two converging trend lines connecting a series of sequential peaks and troughs. These trend lines should be converging at a roughly equal slope.
Mark Minervini VCP Complete Guide
youtu.be/KzEJsqbAmB0
Follow my X profile for FREE proitable trading setups!
x.com/Khalaf_stocks
youtu.be/KzEJsqbAmB0
Follow my X profile for FREE proitable trading setups!
x.com/Khalaf_stocks
免责声明
这些信息和出版物并非旨在提供,也不构成TradingView提供或认可的任何形式的财务、投资、交易或其他类型的建议或推荐。请阅读使用条款了解更多信息。