Tight Range Inside an Up-Channel, Watching 181–180 Zone
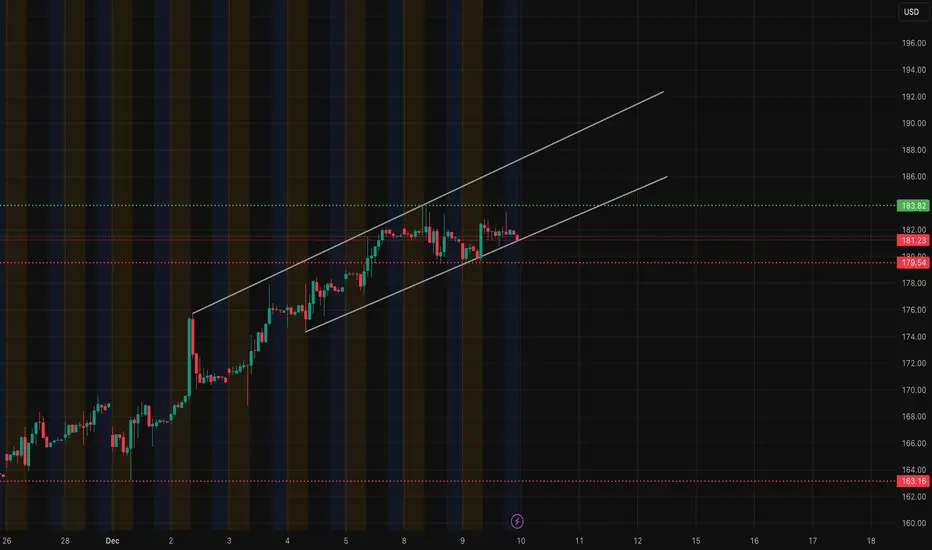
PLTR has been walking up inside a clean ascending channel for several sessions, and today’s structure keeps that story intact — but pressure is building at the mid-channel line.
On the 1H, price is still respecting the channel, but momentum is slowing. You can see several candles failing to push through the 183 area. This is the same zone where sellers stepped in previously, and it lines up with the green resistance band.

The 15-minute SMC chart gives a clearer read on intraday behavior. Earlier we had a BOS toward the upside, but now price is drifting back into the lower half of the wedge. The latest movement shows a CHoCH toward the downside, which warns that buyers are losing control short-term. As long as price sits under 182–182.8, buyers are not in full momentum.
The downside SMC levels at 181.23 → 180.77 → 179.55 are the zones to watch. If PLTR loses 181 with conviction, we likely slide into the discount zones you mapped — especially the 179.5 liquidity level.

Now the GEX chart is important here. PLTR is pinned between heavy call interest above (183–188) and notable put support building near 172.5–170. That creates a compression window around current price. GEX is neutral to slightly supportive but not strong enough to force a breakout on its own. If price stays under 183, dealers aren’t under pressure to hedge upward — meaning upside moves can fade quickly.
So the way I’m looking at this:
If PLTR holds 181 and stays inside the channel bottom, buyers still have a chance to rotate back into 183. That’s the only spot where a real breakout would make sense.
If 181 breaks, it opens the path toward 180 and potentially 179.5, which is where liquidity sits and where price would likely stabilize before deciding the next leg.
This chart right now is about patience. No momentum until one of these levels breaks cleanly.
Disclaimer:
This analysis is for educational purposes only and not financial advice. Always do your own research and manage risk according to your trading plan.
PLTR has been walking up inside a clean ascending channel for several sessions, and today’s structure keeps that story intact — but pressure is building at the mid-channel line.
On the 1H, price is still respecting the channel, but momentum is slowing. You can see several candles failing to push through the 183 area. This is the same zone where sellers stepped in previously, and it lines up with the green resistance band.
The 15-minute SMC chart gives a clearer read on intraday behavior. Earlier we had a BOS toward the upside, but now price is drifting back into the lower half of the wedge. The latest movement shows a CHoCH toward the downside, which warns that buyers are losing control short-term. As long as price sits under 182–182.8, buyers are not in full momentum.
The downside SMC levels at 181.23 → 180.77 → 179.55 are the zones to watch. If PLTR loses 181 with conviction, we likely slide into the discount zones you mapped — especially the 179.5 liquidity level.
Now the GEX chart is important here. PLTR is pinned between heavy call interest above (183–188) and notable put support building near 172.5–170. That creates a compression window around current price. GEX is neutral to slightly supportive but not strong enough to force a breakout on its own. If price stays under 183, dealers aren’t under pressure to hedge upward — meaning upside moves can fade quickly.
So the way I’m looking at this:
If PLTR holds 181 and stays inside the channel bottom, buyers still have a chance to rotate back into 183. That’s the only spot where a real breakout would make sense.
If 181 breaks, it opens the path toward 180 and potentially 179.5, which is where liquidity sits and where price would likely stabilize before deciding the next leg.
This chart right now is about patience. No momentum until one of these levels breaks cleanly.
Disclaimer:
This analysis is for educational purposes only and not financial advice. Always do your own research and manage risk according to your trading plan.
免责声明
这些信息和出版物并非旨在提供,也不构成TradingView提供或认可的任何形式的财务、投资、交易或其他类型的建议或推荐。请阅读使用条款了解更多信息。
免责声明
这些信息和出版物并非旨在提供,也不构成TradingView提供或认可的任何形式的财务、投资、交易或其他类型的建议或推荐。请阅读使用条款了解更多信息。