🔍 PNB
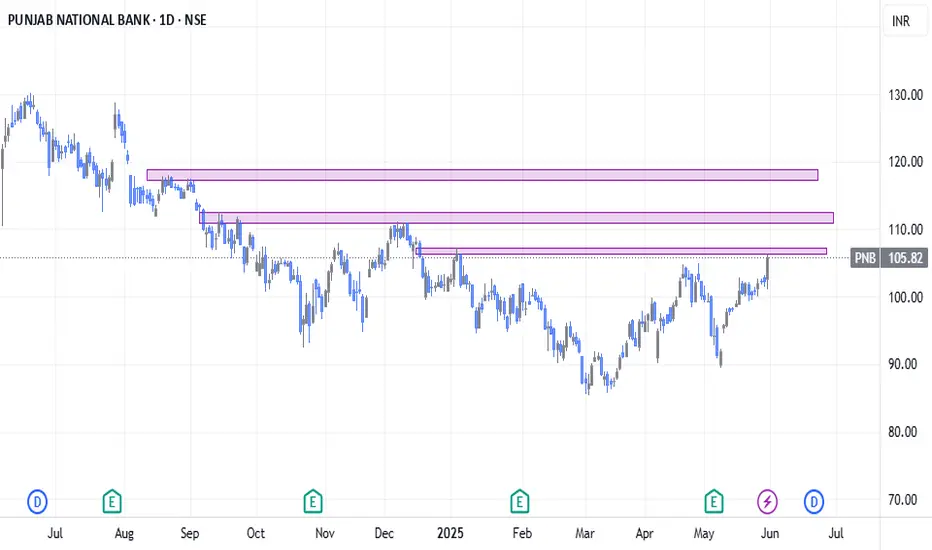
✅ Daily Chart:
PNB took support at the 200-day MA, forming a strong bullish candle — clear sign of buyer strength at a key level.
✅ Weekly Chart:
The stock closed above the 50-week MA, indicating momentum building on a higher timeframe.
🧱 Resistance Zone Ahead – ₹107.20 to ₹112:
Price is nearing a supply zone. Sustaining above ₹107.40 with volume would indicate strength and continuation.
📌 What to Watch:
🔼 Buy Trigger:
Only consider a potential move if price sustains above ₹107.40 with strong momentum and volume confirmation.
💡 Conclusion:
PNB is showing strength with a bullish structure — holding 200 MA on daily and crossing 50 MA on weekly. Focus remains on price action near ₹107.40 for further movement.
📊 Refer to the zones marked in the above chart for better clarity.
⚠️ Disclaimer: This is purely for educational purposes. Not financial advice. Please consult your advisor before making any trading decisions.
交易结束:到达目标
免责声明
这些信息和出版物并不意味着也不构成TradingView提供或认可的金融、投资、交易或其它类型的建议或背书。请在使用条款阅读更多信息。
免责声明
这些信息和出版物并不意味着也不构成TradingView提供或认可的金融、投资、交易或其它类型的建议或背书。请在使用条款阅读更多信息。