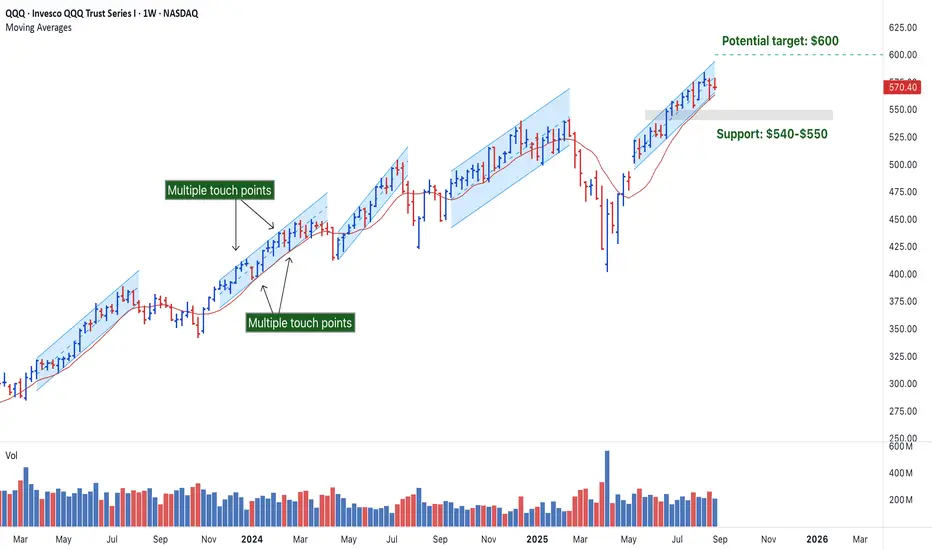
QQQ has been respecting a series of parallel channels since March of 2023, forming a classic stair-step bullish pattern. Each channel ended with a break below the 10-week SMA.
🔸 Strong Trend Structure
▪ The chart shows five clear ascending parallel channels, each followed by a corrective/downward or sideways phase.
▪ This stair-step structure is characteristic of bullish price action, followed by consolidations, which often signals a healthy uptrend.
🔸 Channel Integrity
▪ Each channel respects its upper and lower bounds well, showing consistent buying pressure and trend continuation.
▪ There are multiple touch points for each upper and lower band, showing price support and resistance levels.
▪ The last channel is slightly narrower than the previous ones, which could imply momentum compression before either:
• A breakout (continuation upward).
• A breakdown (channel failure and pullback).
🔸 Risk Zone
▪ If QQQ breaks below the channel support and the 10-week moving average, the next likely support zone is around $540–$550.
🔸 Key Levels
▪ Upside Target: If QQQ breaks above the channel, we could see $600+ based on the measured move of prior legs.
▪ Watch volume for confirmation on any breakout attempt.
▪ Support Zone: If the channel fails, $540–$550 is the first major demand area aligned with prior consolidation.
🔸 Trade Ideas
▪ Bullish Bias: Breakout with strong volume, stop below channel support.
▪ Bearish Bias: Breakdown on confirmed move below channel and moving average.
Note: This is not investment advice. Do your own research before making any trade decisions. Always conduct your own due diligence before investing.
💡 What do you think – continuation or correction? Drop your thoughts in the comments!
Join traders in over 40 countries and LevelUp!
tradingview.com/spaces/LevelUpTools/
tradingview.com/spaces/LevelUpTools/
免责声明
这些信息和出版物并非旨在提供,也不构成TradingView提供或认可的任何形式的财务、投资、交易或其他类型的建议或推荐。请阅读使用条款了解更多信息。
Join traders in over 40 countries and LevelUp!
tradingview.com/spaces/LevelUpTools/
tradingview.com/spaces/LevelUpTools/
免责声明
这些信息和出版物并非旨在提供,也不构成TradingView提供或认可的任何形式的财务、投资、交易或其他类型的建议或推荐。请阅读使用条款了解更多信息。