Will Bulls Defend $17 or Fade Into Deeper Pullback? ⚡️
🟩 Daily Timeframe – Macro Structure and Trend Overview
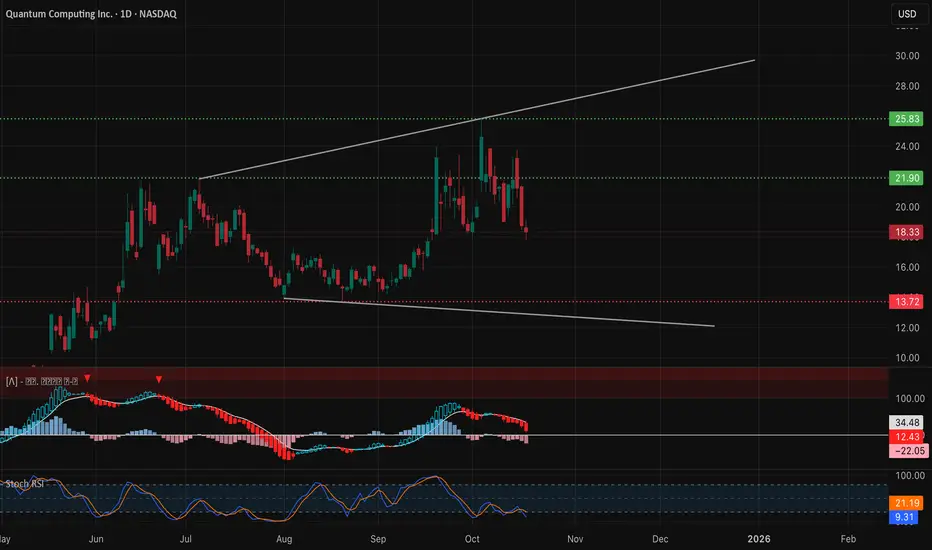
Quantum Computing Inc. (QUBT) has been riding a broad ascending channel since July, making multiple swing highs with consistent liquidity sweeps around $25–$27 before retracing sharply. The recent drop from $24 → $18 marks a continuation of the stock’s oscillating expansion phase — a common pattern in speculative tech plays.
Currently, price is sitting right on a critical midpoint support near $17.7–$18.3, which has acted as a pivot zone multiple times. Holding this area is key to maintaining the bullish midterm structure.
Technicals:
* MACD has flipped bearish with momentum accelerating downward, signaling short-term exhaustion.
* Stoch RSI sits near 9.3, an extreme oversold condition — suggesting potential rebound setup if volume returns.
* The overall structure remains bullish until $13.7 breaks, which is the lower channel base.
If buyers step in early week, the first recovery target sits at $21.5, followed by $25.8, where major resistance converges with the channel top.
🟦 1-Hour Timeframe – Short-Term Channel and Structure Shift

On the 1-hour chart, QUBT has been trending within a clean descending channel, showing alternating CHoCH and BOS events that signal both liquidity grabs and fading momentum.
Key structure details:
* Last CHoCH occurred near $18.6, hinting at a potential reversal but not confirmed yet.
* Price remains capped by the upper descending trendline (~$19.6).
* MACD histogram shows early bullish divergence as selling pressure weakens.
* Stoch RSI rising from 20 zone — watch for crossover above 50 for confirmation.
As long as QUBT holds above $17.8, there’s room for an intraday bounce to $19.5–$20, where short-term supply sits. But if price fails that level and reclaims below $17.1, expect continuation toward $15.8–$16 — the measured channel support.
🟨 15-Minute Timeframe – Micro Liquidity and Momentum Setup

Zooming into the 15-minute chart, QUBT shows compression right at the descending wedge apex, forming a small CHoCH near $18.6, but sellers remain active on every attempt to reclaim the upper trendline.
* BOS around $18.3 suggests localized weakness, but the lower shadows indicate buyers defending near $17.8.
* MACD trending upward with clear momentum divergence (price flat, MACD rising).
* Stoch RSI recovering from 40→60 zone, signaling early upside rotation potential.
If the next 15-minute candle closes above $18.8–$19.0, it confirms the micro breakout, likely pushing QUBT toward $19.6–$20.0 fast. A failed retest, however, could drag price back to $17.7 support for another liquidity sweep.
🎯 Trade Scenarios
Bullish Setup 🟢
* Entry: Above $18.9–$19.1 breakout confirmation.
* Targets: $20 → $21.7 → $23.8.
* Stop-Loss: Below $17.5.
* Confluence: MACD crossover + RSI > 55 + wedge breakout.
Bearish Setup 🔴
* Entry: Breakdown below $17.7–$17.5 or rejection from $19.6.
* Targets: $16 → $13.7.
* Stop-Loss: Above $19.3.
* Confluence: MACD flattening + volume drop on rally attempts.
🧭 Outlook for the Week (Oct 21–25)
QUBT is coiling for a decisive move after multiple rejections from its channel midline. The $17–$18.3 support zone is crucial — defending it could fuel a relief bounce back toward $20+. Losing it may confirm a full retest of the base channel ($13–$14) before another major leg.
Expect volatility spikes early week as quantum-related small caps often move sharply once volume clusters at support. For now, momentum favors cautious accumulation near support, not aggressive chasing.
Disclaimer: This analysis is for educational purposes only and does not constitute financial advice. Always conduct your own research and trade responsibly.
🟩 Daily Timeframe – Macro Structure and Trend Overview
Quantum Computing Inc. (QUBT) has been riding a broad ascending channel since July, making multiple swing highs with consistent liquidity sweeps around $25–$27 before retracing sharply. The recent drop from $24 → $18 marks a continuation of the stock’s oscillating expansion phase — a common pattern in speculative tech plays.
Currently, price is sitting right on a critical midpoint support near $17.7–$18.3, which has acted as a pivot zone multiple times. Holding this area is key to maintaining the bullish midterm structure.
Technicals:
* MACD has flipped bearish with momentum accelerating downward, signaling short-term exhaustion.
* Stoch RSI sits near 9.3, an extreme oversold condition — suggesting potential rebound setup if volume returns.
* The overall structure remains bullish until $13.7 breaks, which is the lower channel base.
If buyers step in early week, the first recovery target sits at $21.5, followed by $25.8, where major resistance converges with the channel top.
🟦 1-Hour Timeframe – Short-Term Channel and Structure Shift
On the 1-hour chart, QUBT has been trending within a clean descending channel, showing alternating CHoCH and BOS events that signal both liquidity grabs and fading momentum.
Key structure details:
* Last CHoCH occurred near $18.6, hinting at a potential reversal but not confirmed yet.
* Price remains capped by the upper descending trendline (~$19.6).
* MACD histogram shows early bullish divergence as selling pressure weakens.
* Stoch RSI rising from 20 zone — watch for crossover above 50 for confirmation.
As long as QUBT holds above $17.8, there’s room for an intraday bounce to $19.5–$20, where short-term supply sits. But if price fails that level and reclaims below $17.1, expect continuation toward $15.8–$16 — the measured channel support.
🟨 15-Minute Timeframe – Micro Liquidity and Momentum Setup
Zooming into the 15-minute chart, QUBT shows compression right at the descending wedge apex, forming a small CHoCH near $18.6, but sellers remain active on every attempt to reclaim the upper trendline.
* BOS around $18.3 suggests localized weakness, but the lower shadows indicate buyers defending near $17.8.
* MACD trending upward with clear momentum divergence (price flat, MACD rising).
* Stoch RSI recovering from 40→60 zone, signaling early upside rotation potential.
If the next 15-minute candle closes above $18.8–$19.0, it confirms the micro breakout, likely pushing QUBT toward $19.6–$20.0 fast. A failed retest, however, could drag price back to $17.7 support for another liquidity sweep.
🎯 Trade Scenarios
Bullish Setup 🟢
* Entry: Above $18.9–$19.1 breakout confirmation.
* Targets: $20 → $21.7 → $23.8.
* Stop-Loss: Below $17.5.
* Confluence: MACD crossover + RSI > 55 + wedge breakout.
Bearish Setup 🔴
* Entry: Breakdown below $17.7–$17.5 or rejection from $19.6.
* Targets: $16 → $13.7.
* Stop-Loss: Above $19.3.
* Confluence: MACD flattening + volume drop on rally attempts.
🧭 Outlook for the Week (Oct 21–25)
QUBT is coiling for a decisive move after multiple rejections from its channel midline. The $17–$18.3 support zone is crucial — defending it could fuel a relief bounce back toward $20+. Losing it may confirm a full retest of the base channel ($13–$14) before another major leg.
Expect volatility spikes early week as quantum-related small caps often move sharply once volume clusters at support. For now, momentum favors cautious accumulation near support, not aggressive chasing.
Disclaimer: This analysis is for educational purposes only and does not constitute financial advice. Always conduct your own research and trade responsibly.
免责声明
这些信息和出版物并不意味着也不构成TradingView提供或认可的金融、投资、交易或其它类型的建议或背书。请在使用条款阅读更多信息。
免责声明
这些信息和出版物并不意味着也不构成TradingView提供或认可的金融、投资、交易或其它类型的建议或背书。请在使用条款阅读更多信息。