Detailed Market Structure Breakdown
4-Hour Chart (Macro Trend)
Structure: The Sensex is in a strong bullish trend and has confirmed a powerful reversal from the 80,200 base. The price is trading within a clear ascending channel, but the close was marked by a bearish candle that rejected the upper trendline and the 82,300 resistance zone.
Key Levels:
Major Supply (Resistance): 82,300 - 82,500. This area is a key overhead supply zone (Order Block) and the high of the recent swing. A decisive breakout here is needed to target 83,000.
Major Demand (Support): 81,500 - 81,750. This area is the key immediate support, aligning with the lower trendline of the ascending channel and a prior FVG (Fair Value Gap).
Outlook: The short-term bias is sideways-to-bullish. The market is expected to consolidate or correct shallowly before attempting another break of the 82,300 supply zone.
1-Hour Chart (Intermediate View)
Structure: The 1H chart shows the market hitting the 82,300 resistance and facing a sharp rejection in the last hours of trading. The index is still within its ascending channel, but the recent price action suggests selling pressure is active at the current high.
Key Levels:
Immediate Resistance: 82,300.
Immediate Support: 81,800 (Lower boundary of the ascending channel and a prior flip zone).
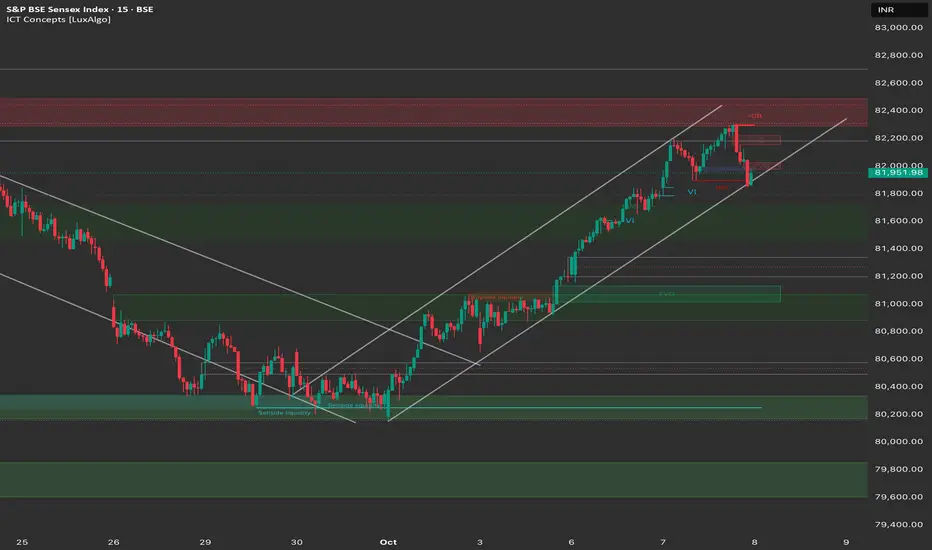
15-Minute Chart (Intraday View)
Structure: The 15M chart shows a clear Market Structure Shift (MSS) to the downside in the last hour of trading, as the price sold off sharply from the 82,300 high. This suggests an intraday profit-booking/correction phase is set to continue.
Key Levels:
Intraday Supply: 82,200.
Intraday Demand: 81,800 - 81,900.
Outlook: Slightly Bearish (Correction/Consolidation).
📈 Trade Plan (Wednesday, 8th October)
Market Outlook: Sensex is facing strong resistance at 82,300 and is due for a healthy consolidation. The strategy should be to buy on dips to the channel support or short a failure at the overhead resistance.
Bullish Scenario (Primary Plan: Buy on Dips)
Justification: The overall structure is bullish. The next move is likely a higher low.
Entry: Look for a long entry on a retest of the 81,600 - 81,800 support zone (lower channel trendline/FVG support) that shows a bullish reversal candle.
Stop Loss (SL): Place a stop loss below 81,500.
Targets:
T1: 82,200 (Retest of Tuesday's high).
T2: 82,400 (Breakout target/Major supply zone).
Bearish Scenario (Counter-Trend: Short at Resistance/Breakdown)
Justification: Profit-booking at the 82,300 supply zone is strong.
Trigger 1 (Failure to Break): Short entry if 82,300 is tested and rejected with a bearish candle.
Trigger 2 (Breakdown): Short entry on a decisive break and 15-minute candle close below 81,750.
Stop Loss (SL): Above 82,450.
Targets:
T1: 81,500 (Major FVG support).
T2: 81,200 (Lower channel line/FVG zone).
Key Levels for Observation:
Immediate Decision Point: 81,800 - 82,300 zone.
Bullish Confirmation: A break and sustained move above 82,400.
Bearish Warning: A move below 81,500 would suggest the correction is deepening.
Line in the Sand: 81,500. Below this level, the short-term uptrend is vulnerable.
4-Hour Chart (Macro Trend)
Structure: The Sensex is in a strong bullish trend and has confirmed a powerful reversal from the 80,200 base. The price is trading within a clear ascending channel, but the close was marked by a bearish candle that rejected the upper trendline and the 82,300 resistance zone.
Key Levels:
Major Supply (Resistance): 82,300 - 82,500. This area is a key overhead supply zone (Order Block) and the high of the recent swing. A decisive breakout here is needed to target 83,000.
Major Demand (Support): 81,500 - 81,750. This area is the key immediate support, aligning with the lower trendline of the ascending channel and a prior FVG (Fair Value Gap).
Outlook: The short-term bias is sideways-to-bullish. The market is expected to consolidate or correct shallowly before attempting another break of the 82,300 supply zone.
1-Hour Chart (Intermediate View)
Structure: The 1H chart shows the market hitting the 82,300 resistance and facing a sharp rejection in the last hours of trading. The index is still within its ascending channel, but the recent price action suggests selling pressure is active at the current high.
Key Levels:
Immediate Resistance: 82,300.
Immediate Support: 81,800 (Lower boundary of the ascending channel and a prior flip zone).
15-Minute Chart (Intraday View)
Structure: The 15M chart shows a clear Market Structure Shift (MSS) to the downside in the last hour of trading, as the price sold off sharply from the 82,300 high. This suggests an intraday profit-booking/correction phase is set to continue.
Key Levels:
Intraday Supply: 82,200.
Intraday Demand: 81,800 - 81,900.
Outlook: Slightly Bearish (Correction/Consolidation).
📈 Trade Plan (Wednesday, 8th October)
Market Outlook: Sensex is facing strong resistance at 82,300 and is due for a healthy consolidation. The strategy should be to buy on dips to the channel support or short a failure at the overhead resistance.
Bullish Scenario (Primary Plan: Buy on Dips)
Justification: The overall structure is bullish. The next move is likely a higher low.
Entry: Look for a long entry on a retest of the 81,600 - 81,800 support zone (lower channel trendline/FVG support) that shows a bullish reversal candle.
Stop Loss (SL): Place a stop loss below 81,500.
Targets:
T1: 82,200 (Retest of Tuesday's high).
T2: 82,400 (Breakout target/Major supply zone).
Bearish Scenario (Counter-Trend: Short at Resistance/Breakdown)
Justification: Profit-booking at the 82,300 supply zone is strong.
Trigger 1 (Failure to Break): Short entry if 82,300 is tested and rejected with a bearish candle.
Trigger 2 (Breakdown): Short entry on a decisive break and 15-minute candle close below 81,750.
Stop Loss (SL): Above 82,450.
Targets:
T1: 81,500 (Major FVG support).
T2: 81,200 (Lower channel line/FVG zone).
Key Levels for Observation:
Immediate Decision Point: 81,800 - 82,300 zone.
Bullish Confirmation: A break and sustained move above 82,400.
Bearish Warning: A move below 81,500 would suggest the correction is deepening.
Line in the Sand: 81,500. Below this level, the short-term uptrend is vulnerable.
免责声明
这些信息和出版物并非旨在提供,也不构成TradingView提供或认可的任何形式的财务、投资、交易或其他类型的建议或推荐。请阅读使用条款了解更多信息。
免责声明
这些信息和出版物并非旨在提供,也不构成TradingView提供或认可的任何形式的财务、投资、交易或其他类型的建议或推荐。请阅读使用条款了解更多信息。