🔹 4H Chart (Swing Bias)
Trend: Clear downtrend with consecutive lower lows inside a red channel.
Recent Move: Price bounced strongly from the 79,800–79,600 demand zone.
FVG: Price is currently reacting to the Fair Value Gap (80,300–80,600).
Resistance: 80,800–81,200 supply + FVG above.
Bias: Temporary relief rally, but macro remains bearish until 81,200 breaks convincingly.
🔹 1H Chart (Intraday Bias)
Structure: Break of structure (BOS) on the upside after strong rejection from 79,800 demand.
Momentum: Short-term bullish push, filling the first FVG around 80,300–80,600.
Liquidity: Buyside liquidity resting near 80,800–81,000 zone.
Bias: Price likely to continue towards 80,800 before facing supply pressure.
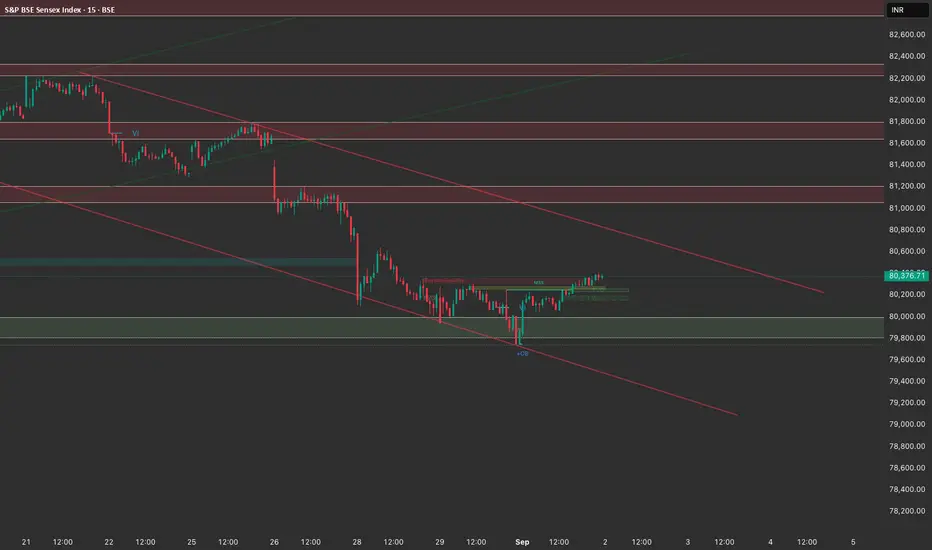
🔹 15M Chart (Execution Bias)
Current Setup: Price is consolidating just above the lower demand (80,200–80,300).
OBs: A bullish OB at 80,100–80,200 could serve as intraday support.
Targets: Immediate target = 80,600; Extended = 80,800.
Stops: Below 79,950 (previous swing low).
📌 Trade Plan for Tomorrow
Primary Bias: Buy on Dips (Intraday Relief Rally)
Entry 1 (Aggressive): 80,200–80,300 retest zone (OB + demand + FVG overlap).
Entry 2 (Conservative): If price sweeps 79,950 and reclaims 80,100 → long setup.
Target 1: 80,600 (FVG fill).
Target 2: 80,800 (liquidity sweep & supply zone).
Stop Loss: Below 79,950 (swing low).
Invalidation: If price closes below 79,800 on 1H → bias flips back bearish, expect 79,400–79,200.
✅ Summary:
Swing bias = Bearish (still inside down channel).
Intraday bias = Bullish relief rally toward 80,800.
Execution = Look for dip buys near 80,200 with SL below 79,950.
Trend: Clear downtrend with consecutive lower lows inside a red channel.
Recent Move: Price bounced strongly from the 79,800–79,600 demand zone.
FVG: Price is currently reacting to the Fair Value Gap (80,300–80,600).
Resistance: 80,800–81,200 supply + FVG above.
Bias: Temporary relief rally, but macro remains bearish until 81,200 breaks convincingly.
🔹 1H Chart (Intraday Bias)
Structure: Break of structure (BOS) on the upside after strong rejection from 79,800 demand.
Momentum: Short-term bullish push, filling the first FVG around 80,300–80,600.
Liquidity: Buyside liquidity resting near 80,800–81,000 zone.
Bias: Price likely to continue towards 80,800 before facing supply pressure.
🔹 15M Chart (Execution Bias)
Current Setup: Price is consolidating just above the lower demand (80,200–80,300).
OBs: A bullish OB at 80,100–80,200 could serve as intraday support.
Targets: Immediate target = 80,600; Extended = 80,800.
Stops: Below 79,950 (previous swing low).
📌 Trade Plan for Tomorrow
Primary Bias: Buy on Dips (Intraday Relief Rally)
Entry 1 (Aggressive): 80,200–80,300 retest zone (OB + demand + FVG overlap).
Entry 2 (Conservative): If price sweeps 79,950 and reclaims 80,100 → long setup.
Target 1: 80,600 (FVG fill).
Target 2: 80,800 (liquidity sweep & supply zone).
Stop Loss: Below 79,950 (swing low).
Invalidation: If price closes below 79,800 on 1H → bias flips back bearish, expect 79,400–79,200.
✅ Summary:
Swing bias = Bearish (still inside down channel).
Intraday bias = Bullish relief rally toward 80,800.
Execution = Look for dip buys near 80,200 with SL below 79,950.
免责声明
这些信息和出版物并不意味着也不构成TradingView提供或认可的金融、投资、交易或其它类型的建议或背书。请在使用条款阅读更多信息。
免责声明
这些信息和出版物并不意味着也不构成TradingView提供或认可的金融、投资、交易或其它类型的建议或背书。请在使用条款阅读更多信息。