Based on the charts and the market's performance on Monday, October 13, the Sensex experienced a sharp pullback from its high, ending its recent winning streak. The current structure is corrective within a larger bullish trend.
Detailed Market Structure Breakdown
4-Hour Chart (Macro Trend)
Structure: The Sensex is still in a bullish recovery phase but has decisively broken below the lower trendline of its very steep short-term ascending channel. The last 4H candle is a bearish candle that breached immediate support levels, confirming the shift to a short-term correction.
Key Levels:
Major Supply (Resistance): 82,300 - 82,500. This area is the critical overhead hurdle (Order Block), which the market was unable to break.
Major Demand (Support): 81,600 - 81,800. This area is the key immediate support, aligning with the major FVG (Fair Value Gap) and the start of the final bullish leg.
Outlook: The short-term bias is sideways-to-bullish. The market is expected to seek support near the 81,600 level.
1-Hour Chart (Intermediate View)
Structure: The 1H chart shows a clear Break of Structure (BOS) to the downside, breaking the lower trendline of the steep ascending channel. The price is now moving within a descending corrective channel.
Key Levels:
Immediate Resistance: 82,150 (Prior consolidation support, now resistance).
Immediate Support: 81,800 (The psychological level and the first major support of the current corrective channel).
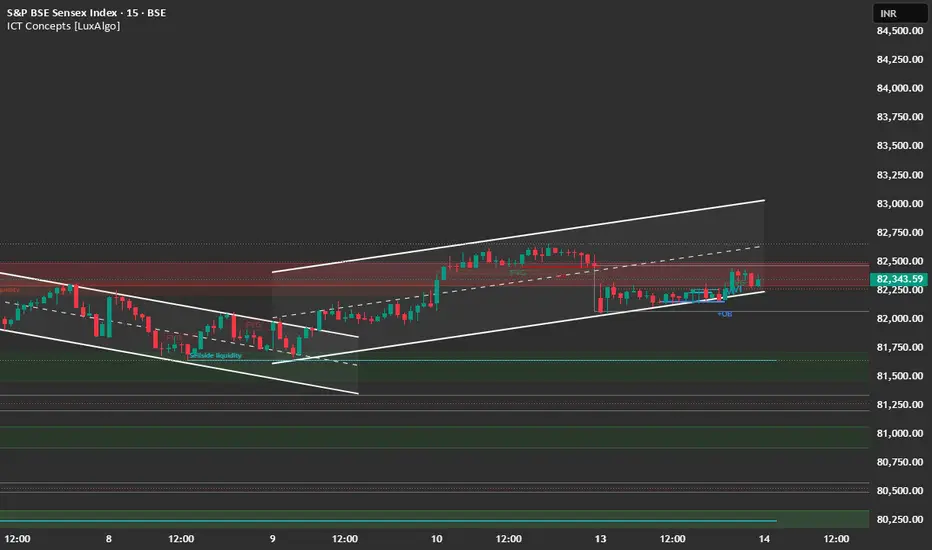
15-Minute Chart (Intraday View)
Structure: The 15M chart confirms the sharp, selling pressure. The market is trading within a descending channel after being rejected from the 82,300 high. The close near the lows indicates bears were in control at the end of the session.
Key Levels:
Intraday Supply: 82,100 (Recent swing high/upper channel boundary).
Intraday Demand: 81,600.
Outlook: Bullish. A "Buy on Dips" strategy is recommended near 82,100.
📈 Trade Plan (Tuesday, 14th October)
Bullish Scenario (Primary Plan)
Justification: Only valid if strong buying emerges to defend the major support and reclaim the entire breakdown structure.
Trigger: A sustained move and close above the resistance at 82,300.
Entry: Long entry on a confirmed 15-minute close above 82,300.
Stop Loss (SL): Below 82,100.
Targets:
T1: 82,500 (Major supply zone).
T2: 82,800 (Extension target).
Bearish Scenario (Counter-Trend/Reversal Plan)
Justification: The breakdown of the steep channel and the heavy rejection from 82,300 favor continuation toward the next major support.
Entry: Short entry on a successful retest and rejection of the 82,000 - 82,100 zone (upper channel resistance). Alternatively, short a decisive break and 15-minute candle close below 81,600.
Stop Loss (SL): Place a stop loss above 82,300 (above the immediate swing high).
Targets:
T1: 81,600 (Major FVG support).
T2: 81,400 (Extension target).
Key Levels for Observation:
Immediate Decision Point: 81,800 - 82,100 zone.
Bearish Confirmation: A break and sustained move below 81,600.
Bullish Confirmation: A move back above 82,300.
Line in the Sand: 81,600. Below this level, the short-term bullish bias is nullified.
Detailed Market Structure Breakdown
4-Hour Chart (Macro Trend)
Structure: The Sensex is still in a bullish recovery phase but has decisively broken below the lower trendline of its very steep short-term ascending channel. The last 4H candle is a bearish candle that breached immediate support levels, confirming the shift to a short-term correction.
Key Levels:
Major Supply (Resistance): 82,300 - 82,500. This area is the critical overhead hurdle (Order Block), which the market was unable to break.
Major Demand (Support): 81,600 - 81,800. This area is the key immediate support, aligning with the major FVG (Fair Value Gap) and the start of the final bullish leg.
Outlook: The short-term bias is sideways-to-bullish. The market is expected to seek support near the 81,600 level.
1-Hour Chart (Intermediate View)
Structure: The 1H chart shows a clear Break of Structure (BOS) to the downside, breaking the lower trendline of the steep ascending channel. The price is now moving within a descending corrective channel.
Key Levels:
Immediate Resistance: 82,150 (Prior consolidation support, now resistance).
Immediate Support: 81,800 (The psychological level and the first major support of the current corrective channel).
15-Minute Chart (Intraday View)
Structure: The 15M chart confirms the sharp, selling pressure. The market is trading within a descending channel after being rejected from the 82,300 high. The close near the lows indicates bears were in control at the end of the session.
Key Levels:
Intraday Supply: 82,100 (Recent swing high/upper channel boundary).
Intraday Demand: 81,600.
Outlook: Bullish. A "Buy on Dips" strategy is recommended near 82,100.
📈 Trade Plan (Tuesday, 14th October)
Bullish Scenario (Primary Plan)
Justification: Only valid if strong buying emerges to defend the major support and reclaim the entire breakdown structure.
Trigger: A sustained move and close above the resistance at 82,300.
Entry: Long entry on a confirmed 15-minute close above 82,300.
Stop Loss (SL): Below 82,100.
Targets:
T1: 82,500 (Major supply zone).
T2: 82,800 (Extension target).
Bearish Scenario (Counter-Trend/Reversal Plan)
Justification: The breakdown of the steep channel and the heavy rejection from 82,300 favor continuation toward the next major support.
Entry: Short entry on a successful retest and rejection of the 82,000 - 82,100 zone (upper channel resistance). Alternatively, short a decisive break and 15-minute candle close below 81,600.
Stop Loss (SL): Place a stop loss above 82,300 (above the immediate swing high).
Targets:
T1: 81,600 (Major FVG support).
T2: 81,400 (Extension target).
Key Levels for Observation:
Immediate Decision Point: 81,800 - 82,100 zone.
Bearish Confirmation: A break and sustained move below 81,600.
Bullish Confirmation: A move back above 82,300.
Line in the Sand: 81,600. Below this level, the short-term bullish bias is nullified.
免责声明
这些信息和出版物并非旨在提供,也不构成TradingView提供或认可的任何形式的财务、投资、交易或其他类型的建议或推荐。请阅读使用条款了解更多信息。
免责声明
这些信息和出版物并非旨在提供,也不构成TradingView提供或认可的任何形式的财务、投资、交易或其他类型的建议或推荐。请阅读使用条款了解更多信息。