Based on the charts and the market's performance on Thursday, October 16, the Sensex experienced a dramatic bullish breakout, surging to a 4-week high and confirming the continuation of its primary uptrend.
Detailed Market Structure Breakdown
4-Hour Chart (Macro Trend)
Structure: The Sensex is in a high-conviction bullish trend. The price has decisively broken out above the major supply zone of 82,300 - 82,500 and is now trading aggressively towards its next major target. The structure is a clear ascending channel, with strong bullish momentum evident across the chart.
Key Levels:
Major Supply (Resistance): 83,600. This area aligns with the upper boundary of the steep ascending channel and a strong resistance line.
Major Demand (Support): 82,400 - 82,600. This area, which includes the previous resistance and a key FVG (Fair Value Gap), is the new must-hold demand zone for the bulls.
Outlook: The short-term bias is aggressively bullish. The market is poised to challenge the 83,600 level and potentially move higher.
1-Hour Chart (Intermediate View)
Structure: The 1H chart shows a clear Break of Structure (BOS) to the upside. The price is trading strongly within a well-defined ascending channel. The close suggests very strong buyer conviction.
Key Levels:
Immediate Resistance: 83,600.
Immediate Support: 83,000 (Psychological level and the lower trendline of the channel).
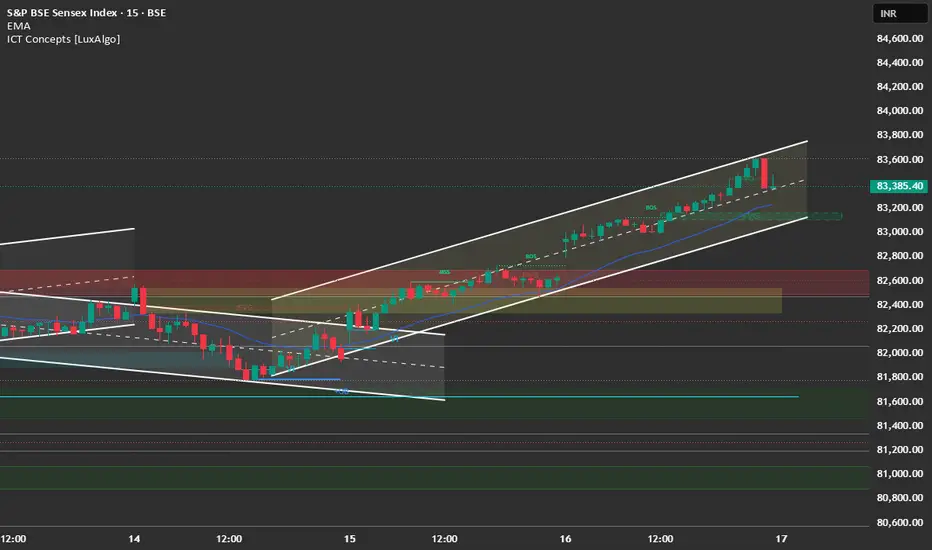
15-Minute Chart (Intraday View)
Structure: The 15M chart confirms the powerful bullish momentum. The market closed right below the day's high after a brief rejection at the top of the channel. The structure suggests immediate follow-through strength is likely.
Key Levels:
Intraday Supply: 83,600.
Intraday Demand: 83,200 (Recent consolidation zone).
Outlook: Aggressively Bullish.
📈 Trade Plan (Friday, 17th October)
Market Outlook: The Sensex is displaying aggressive momentum, led by private banks and financial services. The primary strategy will be to buy on continuation.
Bullish Scenario (Primary Plan)
Justification: The strong breakout and close above the 82,600 zone favor continuation. The next major target is the upper channel boundary.
Entry: Long entry on a decisive break and 15-minute candle close above 83,600. Alternatively, look for a dip entry near 83,200 - 83,300 (the immediate support zone).
Stop Loss (SL): Place a stop loss below 82,900 (below the lower channel trendline).
Targets:
T1: 83,850 (Extension target).
T2: 84,200 (Next resistance).
Bearish Scenario (Counter-Trend Plan)
Justification: High-risk. Only valid if sharp profit booking occurs, potentially triggered by mixed IT earnings or unexpected news.
Trigger: A decisive break and 1-hour candle close below 82,600.
Entry: Short entry below 82,600.
Stop Loss (SL): Above 82,900.
Targets:
T1: 82,300 (Major FVG support).
T2: 82,000 (Psychological support).
Key Levels for Observation:
Immediate Decision Point: 83,200 - 83,600 zone.
Bullish Confirmation: A break and sustained move above 83,600.
Bearish Warning: A move below 83,000 suggests the rally is failing.
Major Event: Infosys, LTIMindtree, Wipro Q2 Results (will influence overall sentiment).
Line in the Sand: 82,600. Below this level, the short-term bullish bias is nullified.
Watch the following video for a Bank Nifty and Nifty outlook: Nifty targeting 25,800 amid strong Q2 numbers; SBI, Shriram Finance among top picks
Detailed Market Structure Breakdown
4-Hour Chart (Macro Trend)
Structure: The Sensex is in a high-conviction bullish trend. The price has decisively broken out above the major supply zone of 82,300 - 82,500 and is now trading aggressively towards its next major target. The structure is a clear ascending channel, with strong bullish momentum evident across the chart.
Key Levels:
Major Supply (Resistance): 83,600. This area aligns with the upper boundary of the steep ascending channel and a strong resistance line.
Major Demand (Support): 82,400 - 82,600. This area, which includes the previous resistance and a key FVG (Fair Value Gap), is the new must-hold demand zone for the bulls.
Outlook: The short-term bias is aggressively bullish. The market is poised to challenge the 83,600 level and potentially move higher.
1-Hour Chart (Intermediate View)
Structure: The 1H chart shows a clear Break of Structure (BOS) to the upside. The price is trading strongly within a well-defined ascending channel. The close suggests very strong buyer conviction.
Key Levels:
Immediate Resistance: 83,600.
Immediate Support: 83,000 (Psychological level and the lower trendline of the channel).
15-Minute Chart (Intraday View)
Structure: The 15M chart confirms the powerful bullish momentum. The market closed right below the day's high after a brief rejection at the top of the channel. The structure suggests immediate follow-through strength is likely.
Key Levels:
Intraday Supply: 83,600.
Intraday Demand: 83,200 (Recent consolidation zone).
Outlook: Aggressively Bullish.
📈 Trade Plan (Friday, 17th October)
Market Outlook: The Sensex is displaying aggressive momentum, led by private banks and financial services. The primary strategy will be to buy on continuation.
Bullish Scenario (Primary Plan)
Justification: The strong breakout and close above the 82,600 zone favor continuation. The next major target is the upper channel boundary.
Entry: Long entry on a decisive break and 15-minute candle close above 83,600. Alternatively, look for a dip entry near 83,200 - 83,300 (the immediate support zone).
Stop Loss (SL): Place a stop loss below 82,900 (below the lower channel trendline).
Targets:
T1: 83,850 (Extension target).
T2: 84,200 (Next resistance).
Bearish Scenario (Counter-Trend Plan)
Justification: High-risk. Only valid if sharp profit booking occurs, potentially triggered by mixed IT earnings or unexpected news.
Trigger: A decisive break and 1-hour candle close below 82,600.
Entry: Short entry below 82,600.
Stop Loss (SL): Above 82,900.
Targets:
T1: 82,300 (Major FVG support).
T2: 82,000 (Psychological support).
Key Levels for Observation:
Immediate Decision Point: 83,200 - 83,600 zone.
Bullish Confirmation: A break and sustained move above 83,600.
Bearish Warning: A move below 83,000 suggests the rally is failing.
Major Event: Infosys, LTIMindtree, Wipro Q2 Results (will influence overall sentiment).
Line in the Sand: 82,600. Below this level, the short-term bullish bias is nullified.
Watch the following video for a Bank Nifty and Nifty outlook: Nifty targeting 25,800 amid strong Q2 numbers; SBI, Shriram Finance among top picks
免责声明
这些信息和出版物并非旨在提供,也不构成TradingView提供或认可的任何形式的财务、投资、交易或其他类型的建议或推荐。请阅读使用条款了解更多信息。
免责声明
这些信息和出版物并非旨在提供,也不构成TradingView提供或认可的任何形式的财务、投资、交易或其他类型的建议或推荐。请阅读使用条款了解更多信息。