🔎 Market Structure (Multi-Timeframe View)
4H Chart
Price is holding above 81,200 support and trading inside an ascending channel.
The immediate resistance zone is 81,600–81,800 (supply + FVG).
EMA (blue) is sloping upwards, showing short-term bullish momentum.
1H Chart
A Break of Structure (BOS) is confirmed above 81,200 → short-term bullish bias.
Price tested 81,600 zone and pulled back slightly, but still holding structure.
Demand zone at 81,200–81,250 is crucial for bulls to defend.
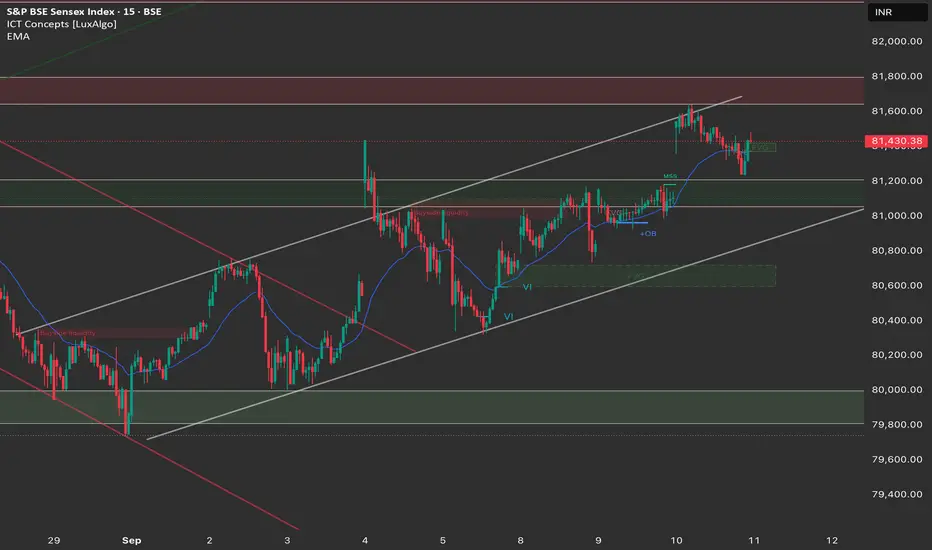
15M Chart
Price tapped into supply at 81,600 and retraced into a small FVG support (81,250–81,300).
Liquidity sweeps are visible on both sides; buyers are still active but need momentum above 81,600 to push higher.
📈 Trade Plan for 11th September
Bias: Bullish (with caution at supply zones)
✅ Long Setup
Entry 1: On retest of 81,200–81,250 demand zone with bullish rejection.
Entry 2: Breakout & retest above 81,600 (supply flip to demand).
Targets:
TP1: 81,450
TP2: 81,600 (supply)
TP3: 81,750–81,800 (major resistance)
Stop Loss: Below 81,100 (to protect against liquidity grab).
❌ Short Setup (Counter-trend scalp only)
Entry: If price rejects 81,600–81,750 supply with bearish confirmation (engulfing / BOS on LTF).
Targets:
TP1: 81,300
TP2: 81,200 (demand retest)
Stop Loss: Above 81,800.
⚠️ Key Levels to Watch
Demand Zones: 81,200–81,250 / 80,800
Supply Zones: 81,600–81,800 / 82,000+
EMA Support (4H): ~81,000
📌 Summary:
As long as 81,200 holds, Sensex remains bullish with potential to retest 81,600–81,800 supply. But if 81,200 breaks, expect a deeper correction toward 80,800.
4H Chart
Price is holding above 81,200 support and trading inside an ascending channel.
The immediate resistance zone is 81,600–81,800 (supply + FVG).
EMA (blue) is sloping upwards, showing short-term bullish momentum.
1H Chart
A Break of Structure (BOS) is confirmed above 81,200 → short-term bullish bias.
Price tested 81,600 zone and pulled back slightly, but still holding structure.
Demand zone at 81,200–81,250 is crucial for bulls to defend.
15M Chart
Price tapped into supply at 81,600 and retraced into a small FVG support (81,250–81,300).
Liquidity sweeps are visible on both sides; buyers are still active but need momentum above 81,600 to push higher.
📈 Trade Plan for 11th September
Bias: Bullish (with caution at supply zones)
✅ Long Setup
Entry 1: On retest of 81,200–81,250 demand zone with bullish rejection.
Entry 2: Breakout & retest above 81,600 (supply flip to demand).
Targets:
TP1: 81,450
TP2: 81,600 (supply)
TP3: 81,750–81,800 (major resistance)
Stop Loss: Below 81,100 (to protect against liquidity grab).
❌ Short Setup (Counter-trend scalp only)
Entry: If price rejects 81,600–81,750 supply with bearish confirmation (engulfing / BOS on LTF).
Targets:
TP1: 81,300
TP2: 81,200 (demand retest)
Stop Loss: Above 81,800.
⚠️ Key Levels to Watch
Demand Zones: 81,200–81,250 / 80,800
Supply Zones: 81,600–81,800 / 82,000+
EMA Support (4H): ~81,000
📌 Summary:
As long as 81,200 holds, Sensex remains bullish with potential to retest 81,600–81,800 supply. But if 81,200 breaks, expect a deeper correction toward 80,800.
免责声明
这些信息和出版物并非旨在提供,也不构成TradingView提供或认可的任何形式的财务、投资、交易或其他类型的建议或推荐。请阅读使用条款了解更多信息。
免责声明
这些信息和出版物并非旨在提供,也不构成TradingView提供或认可的任何形式的财务、投资、交易或其他类型的建议或推荐。请阅读使用条款了解更多信息。