4-Hour Chart (Macro Trend)
Structure: The Sensex has confirmed a Break of Structure (MSS) on the aggressive short-term momentum, breaking below the lower trendline of the steep ascending channel. The price has corrected deeply, with the final 4H candle closing as a large bearish candle.
Key Levels:
Major Supply (Resistance): 84,800 - 85,000. This area (the high from Friday and the FVG on the chart) is the immediate overhead resistance.
Major Demand (Support): 83,600 - 83,900. This area aligns with the lower trendline of the corrective pattern and the FVG (Fair Value Gap), making it the must-hold zone for the overall bullish structure [refer to charts].
Outlook: The bias is Corrective within an Uptrend. We expect the market to continue correcting towards the 83,600 - 83,900 support zone before finding significant buying interest.
1-Hour Chart (Intermediate View)
Structure: The 1H chart shows a clear breakdown from the steep ascending channel. The price is now trading within a newly formed descending channel (or a bearish flag), confirming the short-term correction.
Key Levels:
Immediate Resistance: 84,400 (Upper boundary of the descending channel/FVG).
Immediate Support: 83,800 - 84,000 (Lower channel boundary).
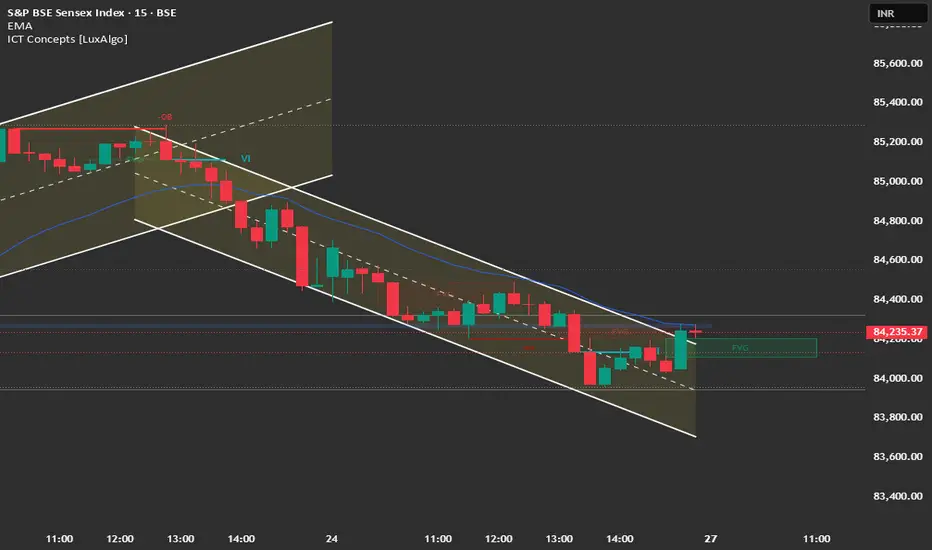
15-Minute Chart (Intraday View)
Structure: The 15M chart confirms the sharp descending channel and strong intraday bearish control. The final close was near the lows, indicating selling pressure remains.
Key Levels:
Intraday Supply: 84,400.
Intraday Demand: 83,800.
Outlook: Bearish for the session open. A "Sell on Rise" strategy is favorable.
📈 Structure Analysis & Trade Plan: 27th October
Market Outlook: Sensex is undergoing a short-term correction after hitting the 85,290 high, driven by renewed trade fears. The primary strategy is to sell the rally/breakdown or buy a major reversal at strong support.
Bearish Scenario (Primary Plan: Correction Continuation/Sell on Rise)
Justification: The sharp breakdown below the channel favors a deeper correction toward the major demand zone.
Entry: Short entry on a retest and rejection of the 84,400 - 84,600 zone (breakdown level/FVG) OR Short a decisive break and 15-minute candle close below 84,000.
Stop Loss (SL): Place a stop loss above 84,800 (above the last swing high/FVG).
Targets:
T1: 83,800 (Lower channel support).
T2: 83,600 (Major FVG support).
T3: 83,200 (Next major support).
Bullish Scenario (Counter-Trend/Reversal)
Justification: Only valid if strong buying emerges, likely on positive global or corporate news.
Trigger: A sustained move and close above 85,000.
Entry: Long entry on a confirmed 15-minute close above 85,000.
Stop Loss (SL): Below 84,500.
Targets:
T1: 85,290 (All-Time High retest).
T2: 85,600 (Extension target).
Key Levels for Observation:
Immediate Decision Point: 83,800 - 84,600 range.
Bearish Confirmation: Sustained trade below 84,000.
Bullish Warning: A move back above 84,800.
Line in the Sand: 83,600. A break below this level shifts the medium-term bias to a deeper corrective phase.
Structure: The Sensex has confirmed a Break of Structure (MSS) on the aggressive short-term momentum, breaking below the lower trendline of the steep ascending channel. The price has corrected deeply, with the final 4H candle closing as a large bearish candle.
Key Levels:
Major Supply (Resistance): 84,800 - 85,000. This area (the high from Friday and the FVG on the chart) is the immediate overhead resistance.
Major Demand (Support): 83,600 - 83,900. This area aligns with the lower trendline of the corrective pattern and the FVG (Fair Value Gap), making it the must-hold zone for the overall bullish structure [refer to charts].
Outlook: The bias is Corrective within an Uptrend. We expect the market to continue correcting towards the 83,600 - 83,900 support zone before finding significant buying interest.
1-Hour Chart (Intermediate View)
Structure: The 1H chart shows a clear breakdown from the steep ascending channel. The price is now trading within a newly formed descending channel (or a bearish flag), confirming the short-term correction.
Key Levels:
Immediate Resistance: 84,400 (Upper boundary of the descending channel/FVG).
Immediate Support: 83,800 - 84,000 (Lower channel boundary).
15-Minute Chart (Intraday View)
Structure: The 15M chart confirms the sharp descending channel and strong intraday bearish control. The final close was near the lows, indicating selling pressure remains.
Key Levels:
Intraday Supply: 84,400.
Intraday Demand: 83,800.
Outlook: Bearish for the session open. A "Sell on Rise" strategy is favorable.
📈 Structure Analysis & Trade Plan: 27th October
Market Outlook: Sensex is undergoing a short-term correction after hitting the 85,290 high, driven by renewed trade fears. The primary strategy is to sell the rally/breakdown or buy a major reversal at strong support.
Bearish Scenario (Primary Plan: Correction Continuation/Sell on Rise)
Justification: The sharp breakdown below the channel favors a deeper correction toward the major demand zone.
Entry: Short entry on a retest and rejection of the 84,400 - 84,600 zone (breakdown level/FVG) OR Short a decisive break and 15-minute candle close below 84,000.
Stop Loss (SL): Place a stop loss above 84,800 (above the last swing high/FVG).
Targets:
T1: 83,800 (Lower channel support).
T2: 83,600 (Major FVG support).
T3: 83,200 (Next major support).
Bullish Scenario (Counter-Trend/Reversal)
Justification: Only valid if strong buying emerges, likely on positive global or corporate news.
Trigger: A sustained move and close above 85,000.
Entry: Long entry on a confirmed 15-minute close above 85,000.
Stop Loss (SL): Below 84,500.
Targets:
T1: 85,290 (All-Time High retest).
T2: 85,600 (Extension target).
Key Levels for Observation:
Immediate Decision Point: 83,800 - 84,600 range.
Bearish Confirmation: Sustained trade below 84,000.
Bullish Warning: A move back above 84,800.
Line in the Sand: 83,600. A break below this level shifts the medium-term bias to a deeper corrective phase.
免责声明
这些信息和出版物并非旨在提供,也不构成TradingView提供或认可的任何形式的财务、投资、交易或其他类型的建议或推荐。请阅读使用条款了解更多信息。
免责声明
这些信息和出版物并非旨在提供,也不构成TradingView提供或认可的任何形式的财务、投资、交易或其他类型的建议或推荐。请阅读使用条款了解更多信息。