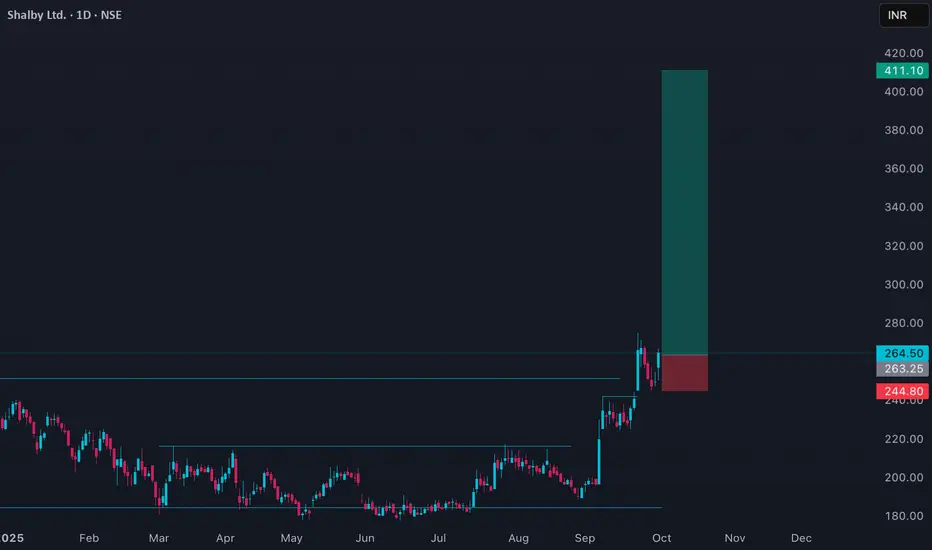
Shalby Limited (SHALBY) is currently in a strong uptrend, closing today at ₹264.85 with a gain of about 6.64%. The stock has traded between ₹250.05 and ₹266.60, showing high momentum and robust volume, indicating strong buying interest.
Price action reveals that SHALBY is trading well above both its 50-day average (~₹214.55) and 200-day average (~₹205.60), confirming the bullish trend. The stock is nearing its 52-week high of ₹282.30, which represents a critical resistance level to watch. Immediate support levels are around ₹250, providing a cushion against potential short-term corrections.
Technical indicators suggest the stock is in an overbought zone, so while the momentum is positive, some consolidation or profit-taking may occur near resistance. Overall, the price action signals continued strength and bullish sentiment, with potential for further upside if the stock breaks above the 52-week high on strong volume.
免责声明
这些信息和出版物并非旨在提供,也不构成TradingView提供或认可的任何形式的财务、投资、交易或其他类型的建议或推荐。请阅读使用条款了解更多信息。
免责声明
这些信息和出版物并非旨在提供,也不构成TradingView提供或认可的任何形式的财务、投资、交易或其他类型的建议或推荐。请阅读使用条款了解更多信息。