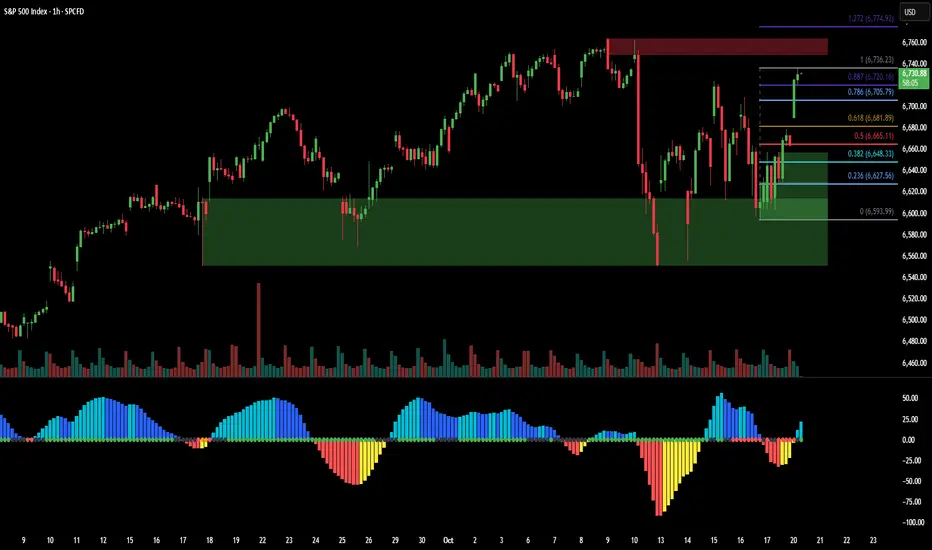
SPX has been climbing steadily off the mid-October demand base near 6,600–6,620, an area that absorbed multiple downside attempts over the past week. The current advance has now retraced the prior swing decline almost in full, reaching into the 0.886–1.0 Fibonacci zone near 6,720–6,736.
This region also overlaps with a prior overhead supply zone (≈ 6,740–6,760) that capped the early-October highs. That confluence makes this area a potential battleground between recovering buyers and residual sellers from the last breakdown.
Key structural notes:
Demand zone: 6,600 – 6,620 remains the short-term pivot for support.
Fib confluence: 0.786 – 1.0 zone aligns with prior rejection levels.
Momentum: Positive but flattening, hinting at possible consolidation if supply reacts.
Watching how SPX behaves inside this upper band will reveal whether the current move is part of a larger trend resumption or simply a retest within a range.
— Volatility Structure Notes
Educational analysis of SPX structure, supply/demand, and volatility context.
免责声明
这些信息和出版物并不意味着也不构成TradingView提供或认可的金融、投资、交易或其它类型的建议或背书。请在使用条款阅读更多信息。
免责声明
这些信息和出版物并不意味着也不构成TradingView提供或认可的金融、投资、交易或其它类型的建议或背书。请在使用条款阅读更多信息。