Has the S&P 500 Found a Support Area?
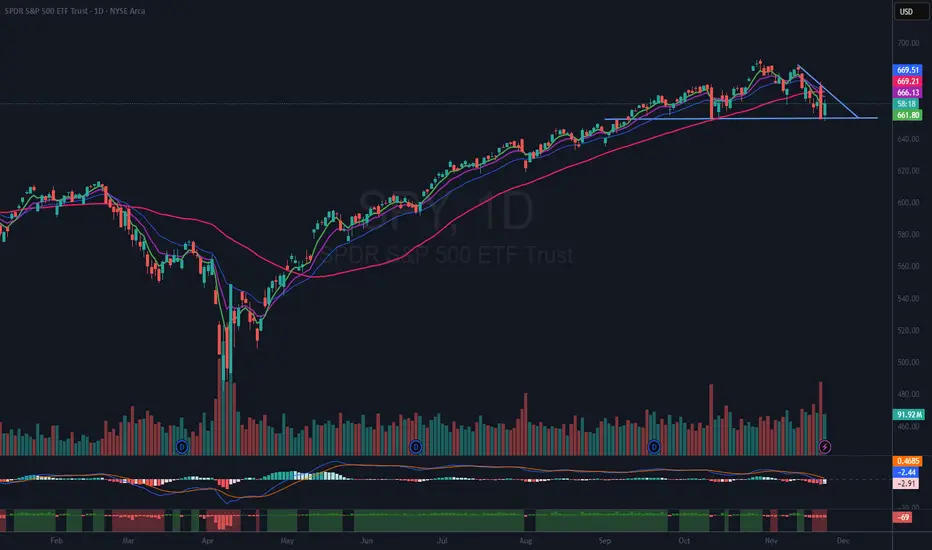
I have closely examined the SPY chart to determine whether the recent correction of 5% plus has reached a bottom. While the answer is uncertain, the chart suggests that the index dropped to a level of interest and subsequently bounced today. However, it remains unclear if today’s bounce signals a true reversal or is simply a temporary movement.
Criteria for Increasing Risk Exposure
To consider re-entering a larger position in the SPY ETF, which I previously trimmed after the price fell below the red 50-day moving average (DMA), I am looking for two critical signals. First, the price must recover the 50 DMA. Second, it needs to break above the downward-sloping trendline. Only if both conditions are met would I contemplate increasing my risk exposure.
Current Approach
At this stage, I am focused solely on observing present conditions and potential future developments. I am refraining from taking further action until clearer signals emerge from the chart.
I have closely examined the
Criteria for Increasing Risk Exposure
To consider re-entering a larger position in the SPY ETF, which I previously trimmed after the price fell below the red 50-day moving average (DMA), I am looking for two critical signals. First, the price must recover the 50 DMA. Second, it needs to break above the downward-sloping trendline. Only if both conditions are met would I contemplate increasing my risk exposure.
Current Approach
At this stage, I am focused solely on observing present conditions and potential future developments. I am refraining from taking further action until clearer signals emerge from the chart.
Ideas I publish are my own. They are not meant to be investment / trading advice. You are encouraged to do your own due diligence.
I am under no obligation to post any action or update to any idea.
Follow me on "X" where I post more content.
I am under no obligation to post any action or update to any idea.
Follow me on "X" where I post more content.
免责声明
这些信息和出版物并非旨在提供,也不构成TradingView提供或认可的任何形式的财务、投资、交易或其他类型的建议或推荐。请阅读使用条款了解更多信息。