SPY at a Decision Point – Will 639 Hold or Break? 📉📈
Technical Analysis (1H Chart)
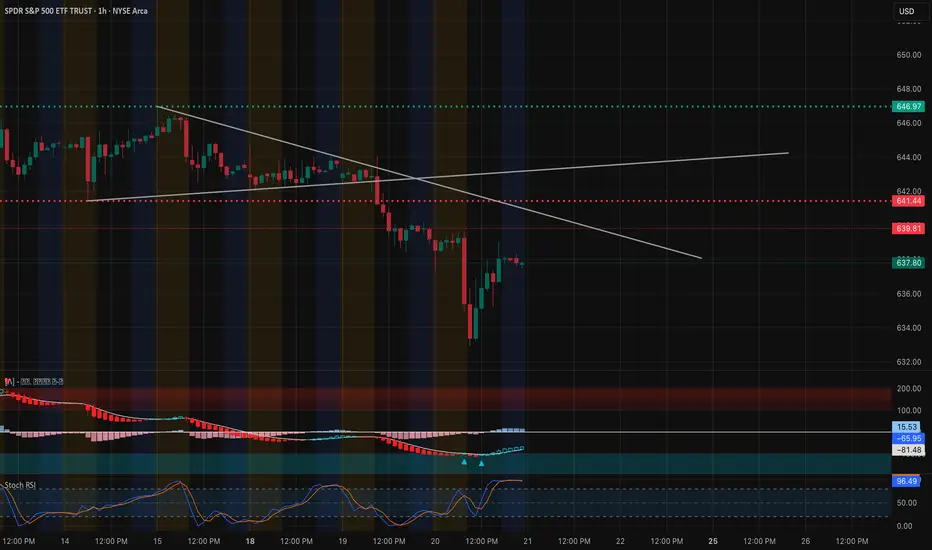
SPY is showing a classic bounce attempt after the sharp selloff. Price is sitting around 637–638, just under the downtrend resistance line. The chart highlights:
* Trendline Pressure: Multiple touches of the descending trendline; rejection risk remains high unless bulls reclaim 641–642.
* Key Support: Buyers defended the 635 zone, with the next strong support down at 632–633. Losing this area could trigger another wave lower.
* Momentum Indicators:
* MACD is trying to curl bullish from oversold, but momentum is shallow.
* Stoch RSI is already extended near overbought — suggesting rallies may stall soon if not confirmed with volume.
* Structure: If SPY fails to clear 641.5–642, we may see another lower-high formation and retest of 635.
Trading View (Intraday):
* Bullish case → Clear break + hold above 642, targeting 646–647 supply zone.
* Bearish case → Failure under 639–641 could drag SPY back toward 635–633.
GEX / Options Sentiment

Options positioning confirms this tight battle zone:
* Call Walls / Resistance:
* 640 → First big resistance, aligning with HVL zone.
* 642–644 → Multiple call walls (9–10% concentration).
* 647–648 → Extreme upside wall, likely gamma cap.
* Put Walls / Support:
* 637 (GEX7 / -11%) → First downside magnet.
* 635 (2nd Put Wall / -20%) → Strong support cluster.
* 632 (GEX10 / -5%) → Deeper downside target if selling extends.
* Net Options Flow:
* Puts dominate ~87% (bearish tilt).
* IVR low (14.4) → cheap options pricing, directional plays favored.
* GEX heavily negative at 639, meaning dealer hedging could accelerate volatility around this pivot.
Thoughts & Suggestions
* Market is heavily leaning bearish, but intraday scalps can flip quickly if bulls reclaim 642.
* For options traders:
* Bullish scalp setup → Calls only if breakout above 642 with momentum confirmation.
* Bearish setup → Favor puts on rejection under 639–641, with 635/632 as profit zones.
* Risk management is key here: chop is possible between 637–641 before a decisive move.
🔔 Conclusion: SPY is at a tight inflection between 639 support and 641–642 resistance. Dealer flow favors downside, but if bulls can reclaim 642, a short squeeze toward 646–647 opens up. Until then, bias stays slightly bearish.
Disclaimer: This analysis is for educational purposes only and not financial advice. Always do your own research and manage risk before trading.
Technical Analysis (1H Chart)
SPY is showing a classic bounce attempt after the sharp selloff. Price is sitting around 637–638, just under the downtrend resistance line. The chart highlights:
* Trendline Pressure: Multiple touches of the descending trendline; rejection risk remains high unless bulls reclaim 641–642.
* Key Support: Buyers defended the 635 zone, with the next strong support down at 632–633. Losing this area could trigger another wave lower.
* Momentum Indicators:
* MACD is trying to curl bullish from oversold, but momentum is shallow.
* Stoch RSI is already extended near overbought — suggesting rallies may stall soon if not confirmed with volume.
* Structure: If SPY fails to clear 641.5–642, we may see another lower-high formation and retest of 635.
Trading View (Intraday):
* Bullish case → Clear break + hold above 642, targeting 646–647 supply zone.
* Bearish case → Failure under 639–641 could drag SPY back toward 635–633.
GEX / Options Sentiment
Options positioning confirms this tight battle zone:
* Call Walls / Resistance:
* 640 → First big resistance, aligning with HVL zone.
* 642–644 → Multiple call walls (9–10% concentration).
* 647–648 → Extreme upside wall, likely gamma cap.
* Put Walls / Support:
* 637 (GEX7 / -11%) → First downside magnet.
* 635 (2nd Put Wall / -20%) → Strong support cluster.
* 632 (GEX10 / -5%) → Deeper downside target if selling extends.
* Net Options Flow:
* Puts dominate ~87% (bearish tilt).
* IVR low (14.4) → cheap options pricing, directional plays favored.
* GEX heavily negative at 639, meaning dealer hedging could accelerate volatility around this pivot.
Thoughts & Suggestions
* Market is heavily leaning bearish, but intraday scalps can flip quickly if bulls reclaim 642.
* For options traders:
* Bullish scalp setup → Calls only if breakout above 642 with momentum confirmation.
* Bearish setup → Favor puts on rejection under 639–641, with 635/632 as profit zones.
* Risk management is key here: chop is possible between 637–641 before a decisive move.
🔔 Conclusion: SPY is at a tight inflection between 639 support and 641–642 resistance. Dealer flow favors downside, but if bulls can reclaim 642, a short squeeze toward 646–647 opens up. Until then, bias stays slightly bearish.
Disclaimer: This analysis is for educational purposes only and not financial advice. Always do your own research and manage risk before trading.
免责声明
这些信息和出版物并非旨在提供,也不构成TradingView提供或认可的任何形式的财务、投资、交易或其他类型的建议或推荐。请阅读使用条款了解更多信息。
免责声明
这些信息和出版物并非旨在提供,也不构成TradingView提供或认可的任何形式的财务、投资、交易或其他类型的建议或推荐。请阅读使用条款了解更多信息。