Watching $672–$674 for Breakout or Rejection ⚖️
1. Market Structure (1H & 15M)
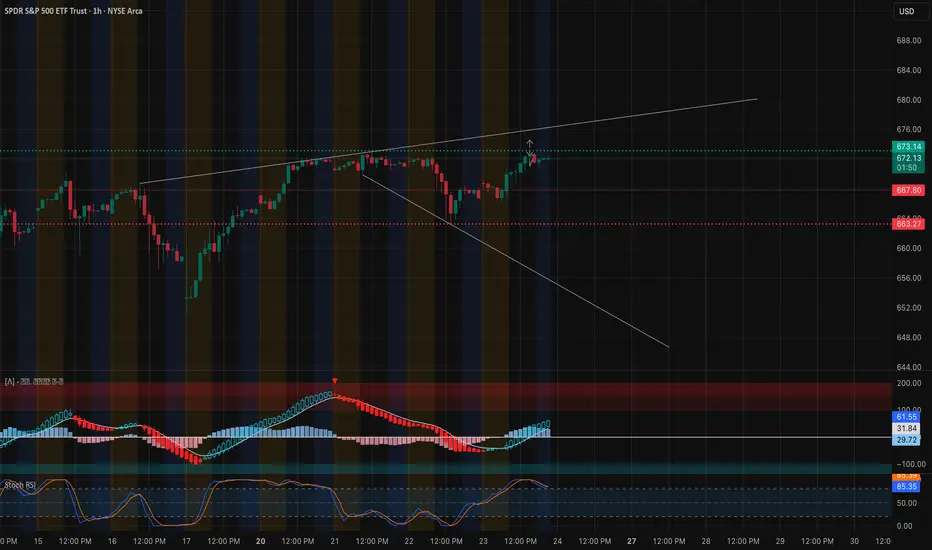
SPY has recovered sharply from last week’s sell-off and is now pressing into a major resistance zone between $672 and $674, where previous liquidity sweeps and BOS (Break of Structure) levels reside. On the 1-hour chart, a clear CHoCH (Change of Character) marks the transition from a bearish to a bullish regime after the rebound from $658.
The structure remains bullish with higher highs and higher lows, but price is now testing the upper trendline of an ascending wedge pattern. A rejection from this zone could trigger a short-term pullback, while a clean breakout and close above $674 could open the path to retest the $680–$682 liquidity pocket.
The 15-minute chart shows the same wedge in more detail. After a small CHoCH near $671, price is stabilizing at the mid-channel. Buyers are absorbing dips, but momentum is flattening — a sign of equilibrium before a potential breakout move during Friday’s session.

2. Supply and Demand / Order Blocks
* Demand Zone: $666–$669 — where previous BOS confirmed buyer defense. This zone overlaps with the 9 EMA cluster and FVG (Fair Value Gap), making it the main reload area for bulls.
* Support Zone: $662–$665 — HVL (High-Volume Level) + PUT wall confluence from the GEX map.
* Supply Zone: $672–$676 — heavy liquidity cluster and previous rejection zone. A break above this level will likely induce dealer hedging and short covering toward $680+.
If SPY reclaims and holds above $674, the structure fully shifts bullish into next week. Conversely, rejection near this area followed by a break below $670 could pull price back toward $665 support before the next rebound attempt.
3. Indicator Confluence
* 9 EMA / 21 EMA: On both 1H and 15M charts, EMAs are still in bullish alignment, but the slope is flattening near resistance — signaling consolidation. If 9EMA crosses back above price with volume pickup, expect continuation higher.
* MACD: On the 1-hour, MACD shows strong recovery momentum, but histogram bars are starting to compress. On the 15-minute, MACD is slightly red, reflecting short-term cooling after an extended push.
* RSI: The 1H RSI sits around 86, nearing overbought territory, suggesting limited room before a short-term cooldown. The 15M RSI has already begun resetting near 53, implying a possible consolidation phase before another push.
* Volume: Volume is tapering as price grinds upward — typical of a rising wedge and often seen before a breakout test or controlled retrace.
4. GEX (Gamma Exposure) & Options Sentiment

The GEX landscape highlights a tight range between $665 (HVL + PUT wall) and $675 (highest positive gamma / CALL resistance). The CALL walls at $672–$675 align perfectly with the technical supply zone.
* Above $674: Dealer hedging could shift bullish, propelling SPY to $680–$682 as gamma flips positive.
* Below $665: Gamma turns negative, opening the door to volatility spikes down to $658.
IVR is 0.5 and IVX avg 15.6 (-4.24%), showing extreme volatility compression — this often precedes an impulsive move. The options flow leans heavily bearish at 85.9% puts, suggesting traders are defensively positioned, which can fuel a short squeeze if SPY breaks above $674.
5. Trade Scenarios for Friday, Oct. 24
Bullish Setup 🟩
* Entry Zone: $670–$671 retest or breakout above $674
* Targets: $676 → $680 → $682
* Stop-Loss: Below $667.5
* Confirmation: Hold above 9EMA on 15M, MACD histogram green, RSI > 60
Bearish Setup 🟥
* Entry Zone: $672–$674 rejection area
* Targets: $669 → $665 → $662
* Stop-Loss: Above $675
* Confirmation: MACD crossdown + CHoCH below $669
6. Closing Outlook for Oct. 24 (Friday)
Friday is shaping up to be a decisive session for SPY — the index ETF is testing a critical gamma and structural resistance zone at $672–$674. The next move from here will likely set the tone heading into next week’s earnings-heavy calendar.
If bulls can push through $674 with conviction, expect a gamma squeeze into $680+ as dealer flows flip long. But if the wedge structure holds and volume weakens, a healthy pullback to $665 support may occur before buyers reload.
The key lies in whether SPY can sustain above $670 during the early Friday session — holding that level keeps control in buyers’ hands.
💬 Final Thought: “SPY is walking the fine line — trapped between $665 support and $674 resistance. Whichever side breaks first will likely dictate the next 10 points of movement. Stay patient — this is a volatility coil ready to spring.”
This analysis is for educational purposes only and not financial advice. Always do your own research and manage your risk before trading.
1. Market Structure (1H & 15M)
SPY has recovered sharply from last week’s sell-off and is now pressing into a major resistance zone between $672 and $674, where previous liquidity sweeps and BOS (Break of Structure) levels reside. On the 1-hour chart, a clear CHoCH (Change of Character) marks the transition from a bearish to a bullish regime after the rebound from $658.
The structure remains bullish with higher highs and higher lows, but price is now testing the upper trendline of an ascending wedge pattern. A rejection from this zone could trigger a short-term pullback, while a clean breakout and close above $674 could open the path to retest the $680–$682 liquidity pocket.
The 15-minute chart shows the same wedge in more detail. After a small CHoCH near $671, price is stabilizing at the mid-channel. Buyers are absorbing dips, but momentum is flattening — a sign of equilibrium before a potential breakout move during Friday’s session.
2. Supply and Demand / Order Blocks
* Demand Zone: $666–$669 — where previous BOS confirmed buyer defense. This zone overlaps with the 9 EMA cluster and FVG (Fair Value Gap), making it the main reload area for bulls.
* Support Zone: $662–$665 — HVL (High-Volume Level) + PUT wall confluence from the GEX map.
* Supply Zone: $672–$676 — heavy liquidity cluster and previous rejection zone. A break above this level will likely induce dealer hedging and short covering toward $680+.
If SPY reclaims and holds above $674, the structure fully shifts bullish into next week. Conversely, rejection near this area followed by a break below $670 could pull price back toward $665 support before the next rebound attempt.
3. Indicator Confluence
* 9 EMA / 21 EMA: On both 1H and 15M charts, EMAs are still in bullish alignment, but the slope is flattening near resistance — signaling consolidation. If 9EMA crosses back above price with volume pickup, expect continuation higher.
* MACD: On the 1-hour, MACD shows strong recovery momentum, but histogram bars are starting to compress. On the 15-minute, MACD is slightly red, reflecting short-term cooling after an extended push.
* RSI: The 1H RSI sits around 86, nearing overbought territory, suggesting limited room before a short-term cooldown. The 15M RSI has already begun resetting near 53, implying a possible consolidation phase before another push.
* Volume: Volume is tapering as price grinds upward — typical of a rising wedge and often seen before a breakout test or controlled retrace.
4. GEX (Gamma Exposure) & Options Sentiment
The GEX landscape highlights a tight range between $665 (HVL + PUT wall) and $675 (highest positive gamma / CALL resistance). The CALL walls at $672–$675 align perfectly with the technical supply zone.
* Above $674: Dealer hedging could shift bullish, propelling SPY to $680–$682 as gamma flips positive.
* Below $665: Gamma turns negative, opening the door to volatility spikes down to $658.
IVR is 0.5 and IVX avg 15.6 (-4.24%), showing extreme volatility compression — this often precedes an impulsive move. The options flow leans heavily bearish at 85.9% puts, suggesting traders are defensively positioned, which can fuel a short squeeze if SPY breaks above $674.
5. Trade Scenarios for Friday, Oct. 24
Bullish Setup 🟩
* Entry Zone: $670–$671 retest or breakout above $674
* Targets: $676 → $680 → $682
* Stop-Loss: Below $667.5
* Confirmation: Hold above 9EMA on 15M, MACD histogram green, RSI > 60
Bearish Setup 🟥
* Entry Zone: $672–$674 rejection area
* Targets: $669 → $665 → $662
* Stop-Loss: Above $675
* Confirmation: MACD crossdown + CHoCH below $669
6. Closing Outlook for Oct. 24 (Friday)
Friday is shaping up to be a decisive session for SPY — the index ETF is testing a critical gamma and structural resistance zone at $672–$674. The next move from here will likely set the tone heading into next week’s earnings-heavy calendar.
If bulls can push through $674 with conviction, expect a gamma squeeze into $680+ as dealer flows flip long. But if the wedge structure holds and volume weakens, a healthy pullback to $665 support may occur before buyers reload.
The key lies in whether SPY can sustain above $670 during the early Friday session — holding that level keeps control in buyers’ hands.
💬 Final Thought: “SPY is walking the fine line — trapped between $665 support and $674 resistance. Whichever side breaks first will likely dictate the next 10 points of movement. Stay patient — this is a volatility coil ready to spring.”
This analysis is for educational purposes only and not financial advice. Always do your own research and manage your risk before trading.
交易开始
update (1-min chart) for scalping:The ascending channel remains intact, but price just rejected near mid-channel and is now testing the 677.50 structure level again — which aligns with the recent BOS (Break of Structure). If this zone holds, SPY could attempt another bounce toward 678.40–678.60 where short-term supply sits. A clean break below 677.48 could confirm continuation to the 676.00 liquidity pocket.
Momentum: MACD histogram is still in the red but showing early signs of slowing bearish momentum. Stochastic is curling up from the oversold zone, suggesting a potential short-term relief push if buyers defend 677.
Outlook:
* Bullish case: Hold 677.4–677.5 and reclaim 678.2 for a potential retest toward upper channel 678.8+.
* Bearish case: Lose 677.4 structure → next magnet sits at 676.0–675.9 where previous demand and volume imbalance exist.
🧭 For now, the structure leans neutral–bearish unless SPY reclaims above 678.4 with strong volume.
免责声明
这些信息和出版物并不意味着也不构成TradingView提供或认可的金融、投资、交易或其它类型的建议或背书。请在使用条款阅读更多信息。
免责声明
这些信息和出版物并不意味着也不构成TradingView提供或认可的金融、投资、交易或其它类型的建议或背书。请在使用条款阅读更多信息。