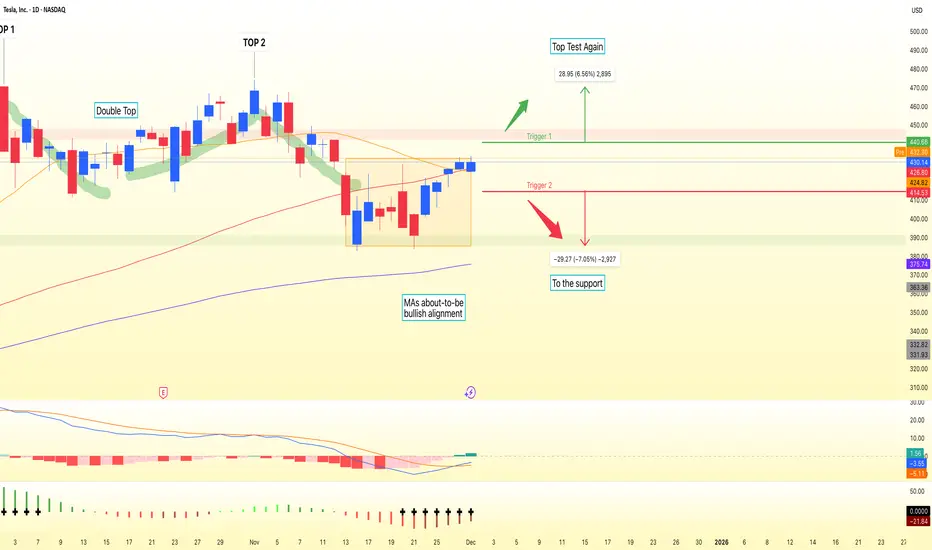
Tesla on the daily chart is stuck in a tight battleground between structure and momentum. Price is consolidating below the 20- and 60-day moving averages after a bearish Market Structure Shift in early November, while still holding above the long-term 120-day moving average. The result is a classic Bear Flag look: a sharp downside pole followed by a choppy, upward-sloping consolidation between the $400 demand zone and $440 supply zone.
As long as TSLA trades inside this band, it’s a range game. The primary path is continuation lower if the Bear Flag resolves as expected. A daily close below roughly $415 would put pressure on the $400 support and open the way toward the $385 area, aligning with the flag breakdown logic and recent downside momentum. For this bearish continuation view, a sustained close back above $430–440 would effectively invalidate the pattern and suggest sellers are losing control.
On the flip side, a clean daily close above $440 would flip the script, clearing both key moving averages and turning the zone into support. That breakout could unlock a move toward the prior October swing region around $470, with the idea invalidated if price drops back into the range and especially below $400. This is a study, not financial advice. Manage risk and invalidations.
Thought of the Day 💡: Often the edge is in letting the market show its hand at the extremes of the range, not in guessing the next candle.
-------------------------
Thanks for your support!
If you found this idea helpful or learned something new, drop a like 👍 and leave a comment, I’d love to hear your thoughts!
follow my X 👉 x.com/bbqgio
🔥 level up your Stock, FX, & Crypto: VIP access to AI technical analysis and pro market insights at TradeOS + 80%-off promo code 'EARLY' 👉
ai.tradeos.xyz/?utm_source=tvbg
🔥 level up your Stock, FX, & Crypto: VIP access to AI technical analysis and pro market insights at TradeOS + 80%-off promo code 'EARLY' 👉
ai.tradeos.xyz/?utm_source=tvbg
相关出版物
免责声明
这些信息和出版物并非旨在提供,也不构成TradingView提供或认可的任何形式的财务、投资、交易或其他类型的建议或推荐。请阅读使用条款了解更多信息。