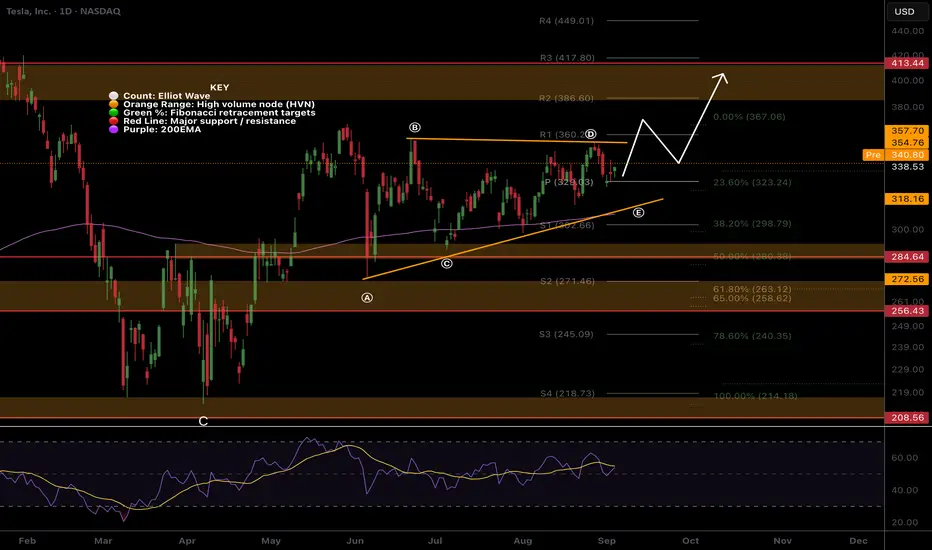
RSI is comfortable at the EQ with room to grow while price remains above the daily pivot.
Analysis is invalidated below wave (C) $284
Safe trading
PhD Cand: Investing & Sentiment , MSc Financial Econ
Trader 8 years, Investor 15 years
The Sentiment Investor - Market Psychology: thesentimentinvestor.substack.com
Trade Planning, Strategies & Signals: Earn & Learn: tradesignals.substack.com
Trader 8 years, Investor 15 years
The Sentiment Investor - Market Psychology: thesentimentinvestor.substack.com
Trade Planning, Strategies & Signals: Earn & Learn: tradesignals.substack.com
相关出版物
免责声明
这些信息和出版物并非旨在提供,也不构成TradingView提供或认可的任何形式的财务、投资、交易或其他类型的建议或推荐。请阅读使用条款了解更多信息。