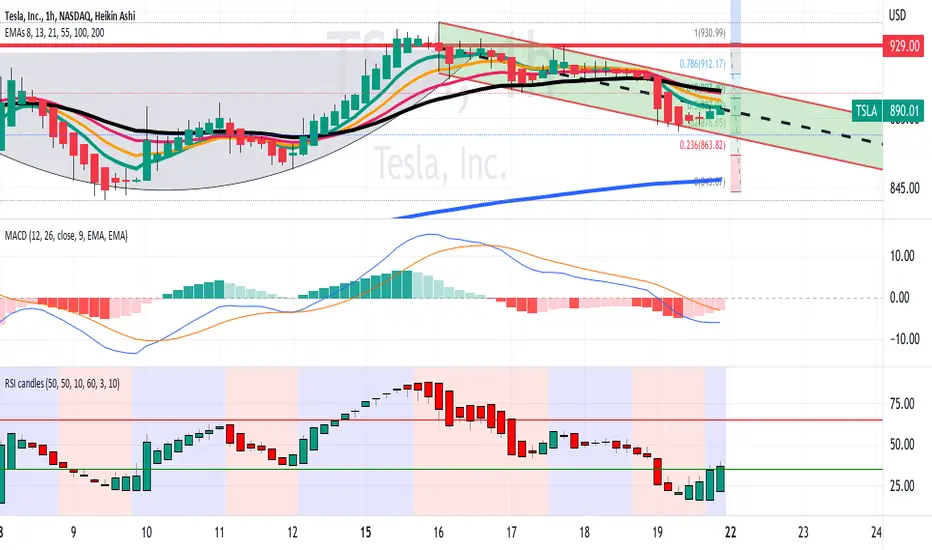
On the 1H timeframe chart, TSLA is showing an early reversal as follows:
(1) It is ascending in a downtrend parallel channel
(2) On the MACD, the signal line is below the histogram, and
the K & D lines are converging on this lagging indicator.
The histogram bars are decreasing in negative height.
(3) the color-coded RSI candle indicator shows bullish engulfing
strength candles.
All in all, I see technical signs of a reversal as described here
免责声明
这些信息和出版物并非旨在提供,也不构成TradingView提供或认可的任何形式的财务、投资、交易或其他类型的建议或推荐。请阅读使用条款了解更多信息。
免责声明
这些信息和出版物并非旨在提供,也不构成TradingView提供或认可的任何形式的财务、投资、交易或其他类型的建议或推荐。请阅读使用条款了解更多信息。