做空
NASDAQ August Analysis
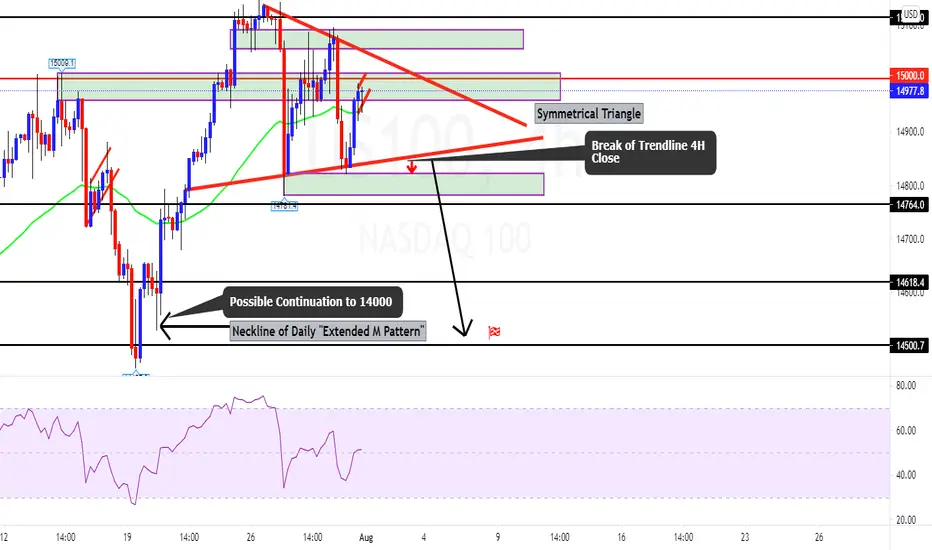
Daily bearish divergence. 4H symmetrical triangle. Currently rising flag pattern on 15 min inside the 4H zone indicating possible sell from zone. Once 4H closes below outside of triangle expecting price to go to 14500. That is neckline of the "Extended M Pattern". Since there is Daily bearish divergence it's possible for continuation from Daily "Extended M Pattern" neckline 14500 to 14000.
免责声明
这些信息和出版物并不意味着也不构成TradingView提供或认可的金融、投资、交易或其它类型的建议或背书。请在使用条款阅读更多信息。
免责声明
这些信息和出版物并不意味着也不构成TradingView提供或认可的金融、投资、交易或其它类型的建议或背书。请在使用条款阅读更多信息。