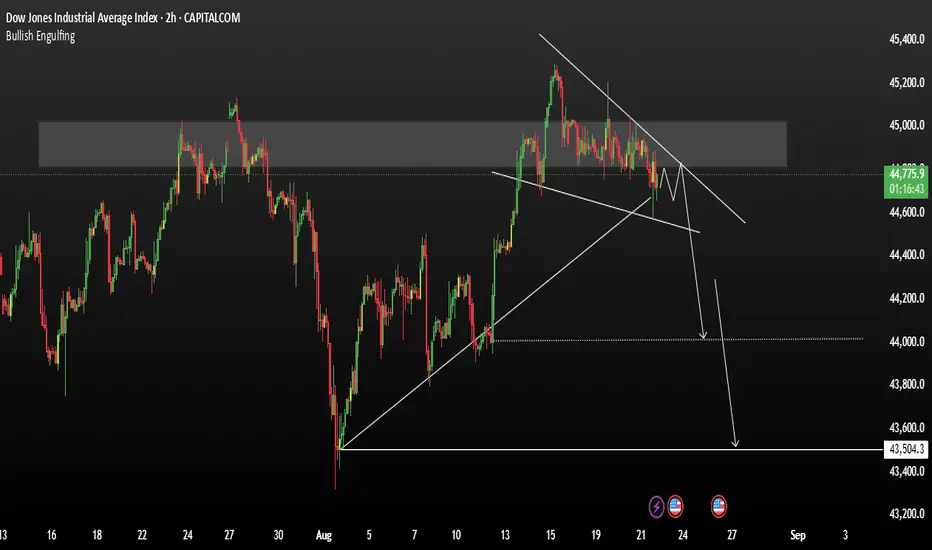
US30 On the left side of the chart, we observed that after breaking below the second major pattern, the US30 experienced a sharp and aggressive decline. A similar structure appears to be forming once again, and notably, the index has just printed another all-time high.
If the price breaks below the current market structure—mirroring the previous breakdown—there is a strong possibility of another significant sell-off. This scenario becomes more likely if we see a clear shift in momentum toward the bearish side.
A confirmed breakdown could trigger a repeat of the past decline, especially if key support levels fail to hold and bearish volume increases.
You may find more details ion the chart.
Trade wisely best of Luck .
Ps; Support with like and comments for better analysis Thanks for supporting.
Join My telegram Channel
t.me/AnalysisGold2
Free Forex Signals
t.me/Jamessignals11
t.me/AnalysisGold2
Free Forex Signals
t.me/Jamessignals11
相关出版物
免责声明
这些信息和出版物并非旨在提供,也不构成TradingView提供或认可的任何形式的财务、投资、交易或其他类型的建议或推荐。请阅读使用条款了解更多信息。
Join My telegram Channel
t.me/AnalysisGold2
Free Forex Signals
t.me/Jamessignals11
t.me/AnalysisGold2
Free Forex Signals
t.me/Jamessignals11
相关出版物
免责声明
这些信息和出版物并非旨在提供,也不构成TradingView提供或认可的任何形式的财务、投资、交易或其他类型的建议或推荐。请阅读使用条款了解更多信息。