US30 (Dow Jones) Technical Analysis – 4H Chart
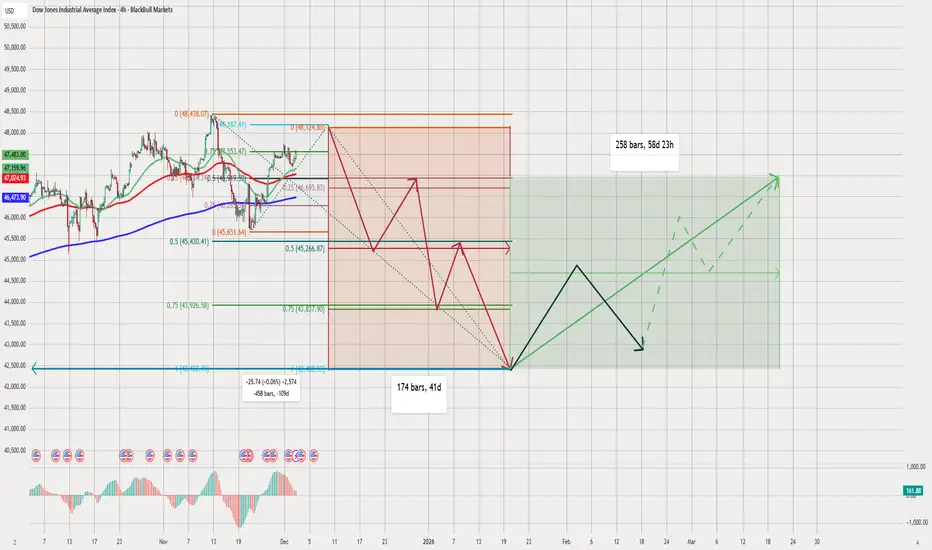
chart shows a well-structured bearish scenario, followed by a medium-term bullish reversal setup. combining Fibonacci retracement levels, time cycles, moving averages, and projected wave paths to map the market direction.
Below is a detailed breakdown:
1️⃣ Current Market Structure
Price recently reached a local top near 48,127.
After this, the chart suggests expect a significant downward correction.
Price is fluctuating above the:
Green MA (short-term)
Red MA (medium-term)
Blue 200 MA (long-term)
projected path shows a breakdown below these moving averages soon.
2️⃣ Fibonacci Levels (Important Zones)
From the recent high, your Fibonacci retracement levels are:
0.25 → 46,699
0.5 → 45,274
0.75 → 43,950
These levels align with your expected downward waves.
Major Support Zone
Large green zone near 41,700 – 42,200
This is where your final bearish wave ends
It also overlaps with a long-term Fibonacci cluster
This suggests it is the target bottom of the correction.
3️⃣ Bearish Projection (Red Wave Path)
chart shows multiple downward swings:
Initial drop from 48,127 → 45,274
Bounce to retest resistance
Deeper decline toward 44,000 – 43,500
Another bounce
Final capitulation to 41,700
🟥 Final Bearish Target:
~41,700
This matches the blue horizontal support line.
🔹 Duration of Bearish Cycle
174 bars (~41 days)
This suggests the decline completes around late January 2026.
4️⃣ Bullish Reversal Phase (Green + Black Path)
After reaching the bottom around 41,700, your chart shows two phases:
Phase 1 – Strong Rebound (Black Path)
A sharp rally into early February:
First rally to around 44,500 – 45,000
Short-term pullback
Then continuation higher
Phase 2 – Trend Recovery (Green Path)
Long-term green path shows:
A steady upward channel
Price aiming toward 48,000 – 49,000 again
The green dotted lines show alternative bullish scenarios
🔹 Total Recovery Time
258 bars (~58 days)
Targeting mid-March 2026 for a full recovery.
5️⃣ Interpretation of Moving Averages
Price will break below the moving averages during the correction.
Long-term recovery will push back above the:
50 MA (green)
100 MA (red)
200 MA (blue)
This confirms a trend reversal after the bottom is hit.
6️⃣ Summary of Your Outlook
📉 Short-Term Bias: Bearish
Price expected to drop from the top
Multiple lower highs / lower lows
Target bottom: 41,700
📉 Medium-Term Bias: Consolidation & Reversal
Strong bounce after the bottom
Wave structure suggests accumulation
📈 Long-Term Bias: Bullish
Recovery back toward all-time highs
Market structure returns to an uptrend by March 2026
✔️ Final Conclusion
chart suggests a full cycle:
Top formation near 48,127
Multi-wave decline (target 41,700)
41-day bearish cycle
Strong bullish reversal
Full recovery within ~58 days
This is a very clean Elliott-wave-style projection supported by Fibonacci and time cycles.
免责声明
这些信息和出版物并非旨在提供,也不构成TradingView提供或认可的任何形式的财务、投资、交易或其他类型的建议或推荐。请阅读使用条款了解更多信息。
免责声明
这些信息和出版物并非旨在提供,也不构成TradingView提供或认可的任何形式的财务、投资、交易或其他类型的建议或推荐。请阅读使用条款了解更多信息。