🔍 XAU/USD Technical Analysis: Major Levels, Market Structure, and Trade Ideas
In this detailed analysis of XAU/USD, we highlight key supply and demand zones, dynamic trendlines, and the interplay of structural shifts to help traders navigate the current price action effectively.
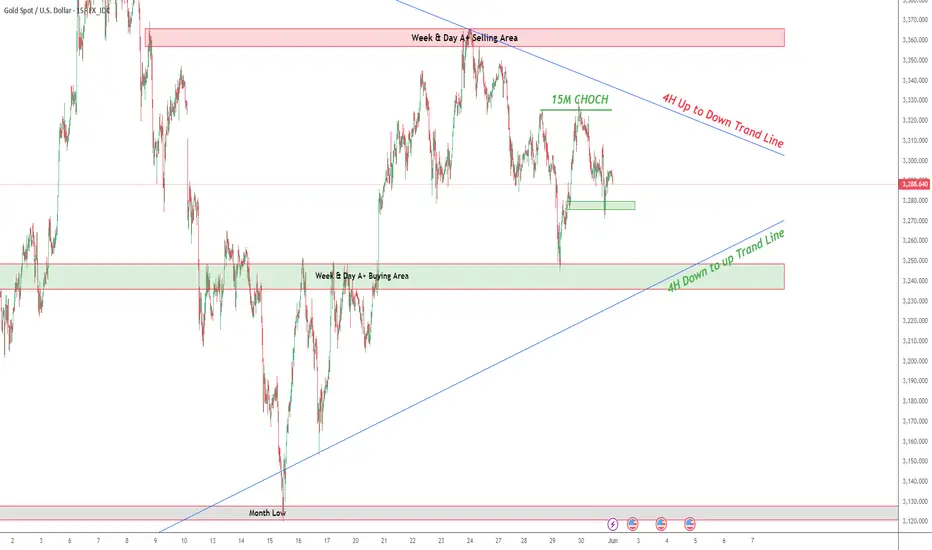
🔴 Key Supply Zone (Week & Day A+ Selling Area)
Location: Above 3,320- 3,330
Significance: This red zone has historically acted as a strong resistance area. Price has failed multiple times to break above it convincingly, suggesting institutional selling pressure.
Implication: Any revisit to this zone could trigger bearish rejection, making it a key level for short setups.
🟢 Major Demand Zone (Week & Day A+ Buying Area)
Location: 3,230–3,260 region
Significance: This green zone has consistently provided support for price, as shown by multiple bounces from it. It suggests strong buying interest from institutions or large market participants.
Implication: Traders can watch for bullish price action in this area to confirm potential long opportunities.
📈 Dynamic Trendlines
🔵 4H Down-to-Up Trend Line:
This ascending trendline, drawn from major swing lows, suggests that the broader 4H market structure remains bullish.
Use: Acts as dynamic support for possible bounces.
🔴 4H Up-to-Down Trend Line:
This descending trendline captures the bearish structure in the 4H timeframe, connecting the lower highs and indicating ongoing selling pressure.
Use: Functions as a dynamic resistance area.
✅ 15M Change of Character (CHoCH)
This micro timeframe level marks a shift in sentiment from bearish to bullish, providing early confirmation for potential reversals or continuation plays.
Use: Intraday traders can utilize this for short-term entries in line with the broader bias.
🔻 Monthly Low Level
Location: Around 3,120
Significance: This level marks the lowest point in the recent monthly cycle and serves as a crucial support area for the broader trend.
Implication: A break below this level would suggest further downside potential.
💡 Trade Scenarios
1️⃣ Bullish Scenario
If price retests the Week & Day A+ Buying Area (3,240–3,260) and forms bullish confirmation (like a bullish engulfing candle or 15M CHoCH shift), a long trade could be initiated.
Potential Targets:
4H descending trendline near 3,300
Week & Day A+ Selling Area above 3,320
2️⃣ Bearish Scenario
If price reaches the 4H descending trendline or the selling zone above 3,320 and forms bearish rejection, shorts can be considered.
A break below the 4H ascending trendline and the demand zone would open the door for deeper downside, with the ultimate target at the Month Low near 3,120.
📝 Conclusion
XAU/USD is consolidating within a crucial range, balancing supply and demand forces. The dual-trendline structure signals a potential breakout in the coming sessions. Short-term traders can leverage the 15M CHoCH for early entries, while swing traders should focus on the interplay between the higher timeframe zones and trendlines.
📌 Reminder: Always wait for confirmation before entering trades and manage risk according to your trading plan.
🔔 Follow for updates! Let me know if you have any questions or want to discuss your own analysis. Happy trading! 🚀✨
In this detailed analysis of XAU/USD, we highlight key supply and demand zones, dynamic trendlines, and the interplay of structural shifts to help traders navigate the current price action effectively.
🔴 Key Supply Zone (Week & Day A+ Selling Area)
Location: Above 3,320- 3,330
Significance: This red zone has historically acted as a strong resistance area. Price has failed multiple times to break above it convincingly, suggesting institutional selling pressure.
Implication: Any revisit to this zone could trigger bearish rejection, making it a key level for short setups.
🟢 Major Demand Zone (Week & Day A+ Buying Area)
Location: 3,230–3,260 region
Significance: This green zone has consistently provided support for price, as shown by multiple bounces from it. It suggests strong buying interest from institutions or large market participants.
Implication: Traders can watch for bullish price action in this area to confirm potential long opportunities.
📈 Dynamic Trendlines
🔵 4H Down-to-Up Trend Line:
This ascending trendline, drawn from major swing lows, suggests that the broader 4H market structure remains bullish.
Use: Acts as dynamic support for possible bounces.
🔴 4H Up-to-Down Trend Line:
This descending trendline captures the bearish structure in the 4H timeframe, connecting the lower highs and indicating ongoing selling pressure.
Use: Functions as a dynamic resistance area.
✅ 15M Change of Character (CHoCH)
This micro timeframe level marks a shift in sentiment from bearish to bullish, providing early confirmation for potential reversals or continuation plays.
Use: Intraday traders can utilize this for short-term entries in line with the broader bias.
🔻 Monthly Low Level
Location: Around 3,120
Significance: This level marks the lowest point in the recent monthly cycle and serves as a crucial support area for the broader trend.
Implication: A break below this level would suggest further downside potential.
💡 Trade Scenarios
1️⃣ Bullish Scenario
If price retests the Week & Day A+ Buying Area (3,240–3,260) and forms bullish confirmation (like a bullish engulfing candle or 15M CHoCH shift), a long trade could be initiated.
Potential Targets:
4H descending trendline near 3,300
Week & Day A+ Selling Area above 3,320
2️⃣ Bearish Scenario
If price reaches the 4H descending trendline or the selling zone above 3,320 and forms bearish rejection, shorts can be considered.
A break below the 4H ascending trendline and the demand zone would open the door for deeper downside, with the ultimate target at the Month Low near 3,120.
📝 Conclusion
XAU/USD is consolidating within a crucial range, balancing supply and demand forces. The dual-trendline structure signals a potential breakout in the coming sessions. Short-term traders can leverage the 15M CHoCH for early entries, while swing traders should focus on the interplay between the higher timeframe zones and trendlines.
📌 Reminder: Always wait for confirmation before entering trades and manage risk according to your trading plan.
🔔 Follow for updates! Let me know if you have any questions or want to discuss your own analysis. Happy trading! 🚀✨
免责声明
这些信息和出版物并不意味着也不构成TradingView提供或认可的金融、投资、交易或其它类型的建议或背书。请在使用条款阅读更多信息。
免责声明
这些信息和出版物并不意味着也不构成TradingView提供或认可的金融、投资、交易或其它类型的建议或背书。请在使用条款阅读更多信息。